Particularly for selenomethionine-phased proteins, data is often gathered at a wavelength where the scattering factor of some atom is significantly different from the value at the copper-alpha edge (1.5418 Å, 8.04keV).
autoBUSTER uses scattering factors for Cu-Kα by default, and for certain structures this leads to very large peaks in the difference maps. This example uses 3ckm, deposited on 13 May 2008; see AutoBusterExampleUsingPDB for how the files you can download from http://www.rcsb.org are turned into PDB and MTZ files usable by autoBUSTER.
The initial refinement with default options
refine -p 3ckm/3ckm.pdb -m 3ckm/3ckm.mtz -d r3ckm | tee r3ckm.lis
gives about twenty negative difference peaks of amplitude > 7σ, nearly all of which are near selenium atoms and look like
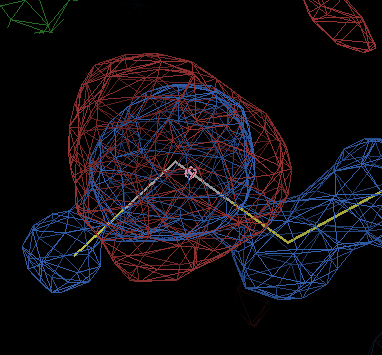
The end-of-refinement statistics show
best refinement in BUSTER-GELLY-TNT reached for FP,SIGFP with R/Rfree 0.1840/0.2129
If you're analysing the results of your own MAD experiment, you will usually have a fluorescence scan from which you have a direct measurement of the f' value for your major scatterer. This information doesn't tend to get recorded in the PDB deposition, so in this case we need to estimate f' from the wavelength.
3ckm is an MAD-phased structure, and the wavelength line in the PDB file reads
REMARK 200 WAVELENGTH OR RANGE (A) : 0.97857,0.97843,0.96321
The cif2mtz program converts the first of the four datasets in the deposited sf.cif file to MTZ format, but does not fill in the wavelength; looking at the sf.cif file in a text editor, lines 44-45 read
_diffrn_radiation_wavelength.wavelength
1  0.97843
and so the MTZ file that we are working with is at 0.97843Å.
Find an estimate for the cross-section using the CCP4 program crossec; you can drive it by hand by running crossec then typing
ATOM SE
CWAV 1 0.97843 0.0001
END
or automatically by
echo -e " atom SE\n cwav 1 0.97843 0.0001\n END" | crossec | grep ^SE
which produces the single line
SE 0.9784 -6.5078 3.8356
So, the f' value for selenium at this wavelength is -6.5, and the f" value is 3.8 ... don't bother with any more decimal places.
An MAD experiment uses three wavelengths - peak, inflection and remote - and of these the inflection is the longest, the remote is the shortest, and the peak the one in the middle.
So, since the middle wavelength listed in the REMARK 200 WAVELENGTH line is the 0.97843Å whose dataset is in our .mtz file, we could assume that it's the selenium peak, and that the form factor therefore should be the form factor that crossec reports for selenium at its peak. This isn't a particularly good argument, since the chemical environment changes which move the peak in wavelength may well also change its amplitude, but if you believe it you can give crossec input like
atom se
cwav 99 0.97843 0.0001
end
which displays theoretical form-factor values sampled at 0.0001Å intervals. The peak is fairly clear
SE          0.9792    -8.1650     3.8423
SE          0.9793    -8.8259     3.8432
SE          0.9794   -10.9015     3.8440
SE          0.9795    -9.1707     0.4992
SE          0.9796    -8.3353     0.4993
and so you'd have f'=-10.9, f"=3.8.
To use the new cross-section, the command is
refine -p 3ckm/3ckm.pdb -m 3ckm/3ckm.mtz -d r3ckm-newCS FormfactorCorrection="Se:-6.5" | tee r3ckm-newCS.lis
The message
NOTE : for atom "Se" we're going to correct the
       normal scattering factor with f' = "-6.5"
appears in the log to confirm that the new form factor data is being used, and at the end of refinement we have
best refinement in BUSTER-GELLY-TNT reached for FP,SIGFP with R/Rfree 0.1815/0.2117
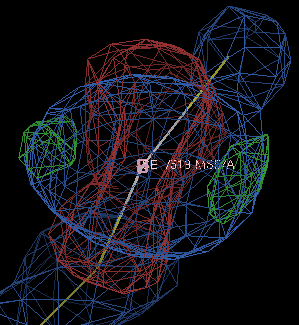
So the R/Rfree has not changed all that much, but the difference density is now a better shape:
If you are being very careful, you might want to run refinements with a range of form-factor corrections and see which gives the best-looking density; using -9.0 gives the difference density below
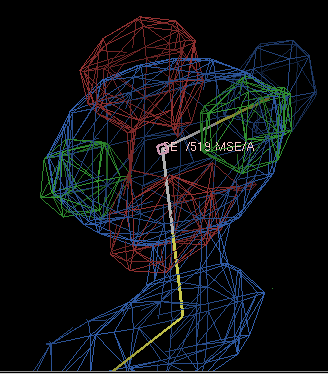
which is fairly clearly due to the ellipsoidal shape of the selenium electron density.
If you don't like looking at lots of subtly different electron density maps, you might want to consider using some kind of Rsleep strategy (see Gerard Kleywegt's paper Separating model optimization and model validation in statistical cross-validation as applied to crystallography): remove the reflections corresponding to the free set from your data, set some other subset of reflections as free, and optimise the form-factor correction to minimise Rfree measured against that set.
Page by Tom Womack; original version 30 May 2008, updated for 2009 release 15 July 2009. Address problems, corrections and clarifications to buster-develop@globalphasing.com