| Attachments | |
|---|---|
| 3nrz.wrongstart.png | 8K |
| 3nrz.rightpostref.png | 8K |
| insulin-five.png | 8K |
| insulin-six.png | 8K |
| 3nrz.wrongpostref.png | 9K |
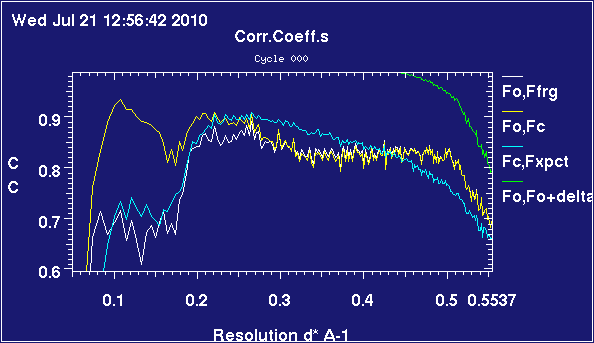
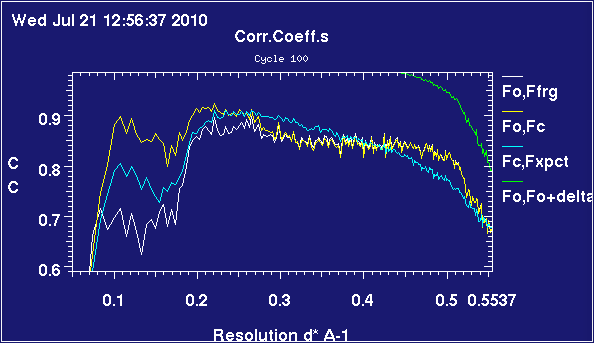
These plots are obtained from 2omg, which is a trimer of insulin heterodimers. It's been refined twice, once complete and once with chain C deleted.
The relevant difference is that, for the map with a substantial missing part, the refinement is having difficulty matching data in the lower resolution bins - observe that, whilst the correlations are above 90% almost all the way in the case with six chains present, they are below 80% up to 0.2 inverse-angstrom when one chain is missing. The correlations are very similar above 0.4 inverse-angstrom, corresponding to details on the order of scale of side-chains.
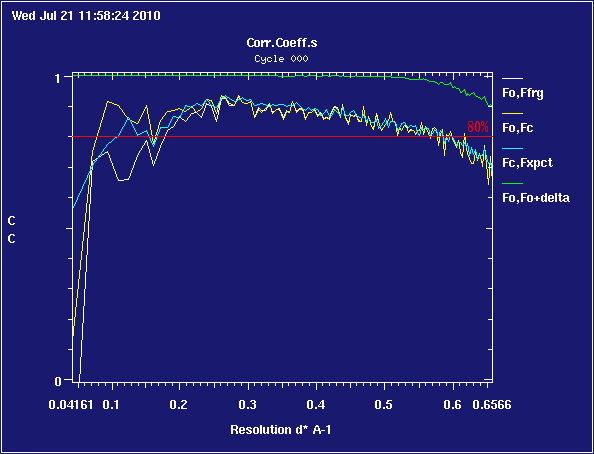
In this example, the input model is missing about sixty residues, both at termini of several chains and in internal loops, which show up very well-ordered in the electron density.
 The correlation left of 0.2 A-1 is a bit improved, but note that the blue line still crosses the yellow one
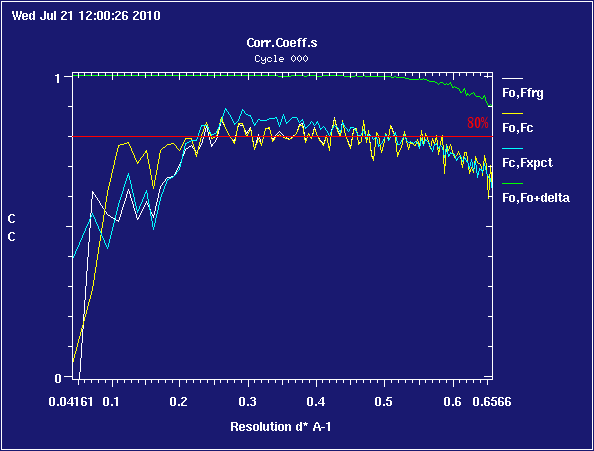
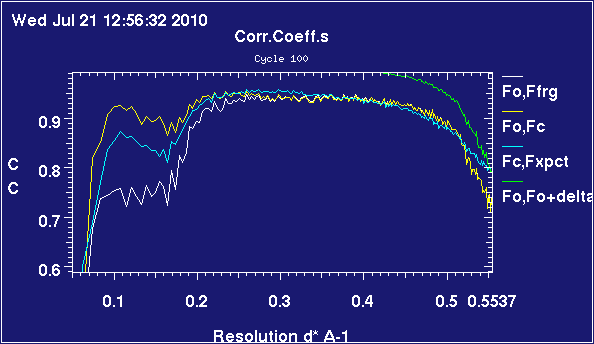 Notice that the blue line now tracks the yellow one much more closely