WORK-IN-PROGRESS
The data was collected on 18th March 2020 at beamline 19-ID (SBC-CAT, APS).
We have two distinct sweeps of data available:
     y3_b07_#####.cbf   : 1 - 60
     y3_b07b_#####.cbf  : 2 - 140
At first sight this seems a slightly unusual strategy given the characteristics of the detector used (Förster et al, 2019). We would usually want to see low-dose, high-multiplicity, fine-sliced data collected at modern synchrotrons with the current generation of detectors (Pflugrath, 1999, Mueller at al, 2012).
It is also unfortunate that the second sweep was started again at the same Omega angle (–90) as the first one. So although 100 degrees of data was collected, only 70 degrees of rotation is covered - which for monoclinic C2 results in very poor overall completeness (but then: even 100 degrees would have been problematic): see e.g. PDBpeep.
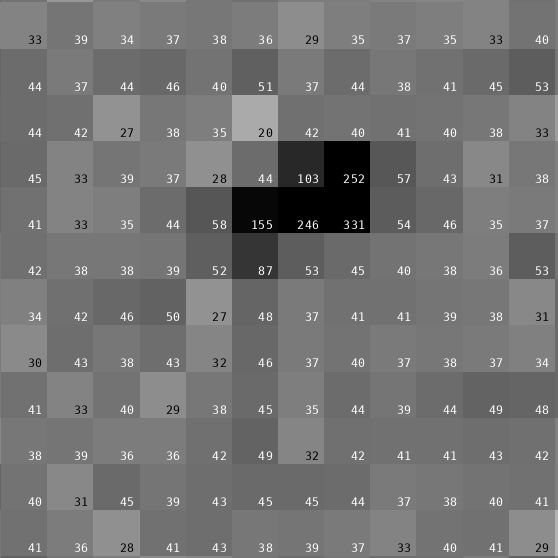
The images have a very high average background value of about 40 counts
This seems to suggest that there could have been at least a factor of 10 reduction in dose per 0.5 degree image. A better sampling of the reflection profile (through fine-slicing) would have been possible by using 0.1 degree per image with an exposure time of 0.1 seconds: this would have put the same amount of dose into the crystal as the current 0.5sec/0.5deg. The Pilatus3 6M can run at a frame rate of 25Hz, i.e. at 0.04 sec/image). So one could collect data as
  sweep 1: 0.1  deg/image
           0.05 sec/image
           100% transmission
           60   degrees of data
           start at Omega=-90
  sweep 2: 0.1  deg/image
           0.05 sec/image
           100% transmission
           140  degrees of data
           start at Omega=-30
which would have put the exact same dose into the crystal with the same collection wall clock time - but would result in a low-dose and fine-sliced dataset of adequate multiplicity (200 degrees of rotation covered instead of 70 degrees). It is most likely, that halving the transmission would have been a better strategy on top of this (achieving high multiplicity via 400 degrees of data on top of low-dose and fine-slicing), so
  sweep 1: 0.1  deg/image
           0.05 sec/image
           50%  transmission
           120  degrees of data
           start at Omega=-90
  sweep 2: 0.1  deg/image
           0.05 sec/image
           50%  transmission
           280  degrees of data
           start at Omega=+30
The total collection time would have been longer though: 200 seconds instead of 100 seconds. but given the fact that it took 224 seconds to recenter (?) the crystal between sweep 1 and 2, those additional 100 seconds of time do not seem crucial. If we assume that the initial centering took a similar amount of time, we have for the current data collection
  sweep 1 centering  : 225 sec
          collection :  30 sec
  sweep 2 centering  : 225 sec
          collection :  70 sec
 ------------------------------
  total                550 sec =  9 min 10 sec
and a slightly different strategy described above:
  sweep 1 centering  : 225 sec
          collection :  60 sec
  sweep 2 centering  : 225 sec
          collection : 140 sec
 ------------------------------
  total                650 sec = 10 min 50 sec
Remember: we can always glue fine-sliced images together (creating 0.5 degree images out of five 0.1 degree images) - but we can never split images collected in wide-slicing mode.
After downloading the images (and placing the mini-cbf files into a directory Images), we can run autoPROC on that dataset via
process ReverseRotationAxis=yes -I Images -d 00 | tee 00.lisThe extra keyword is recorded on our beamline settings wiki page.
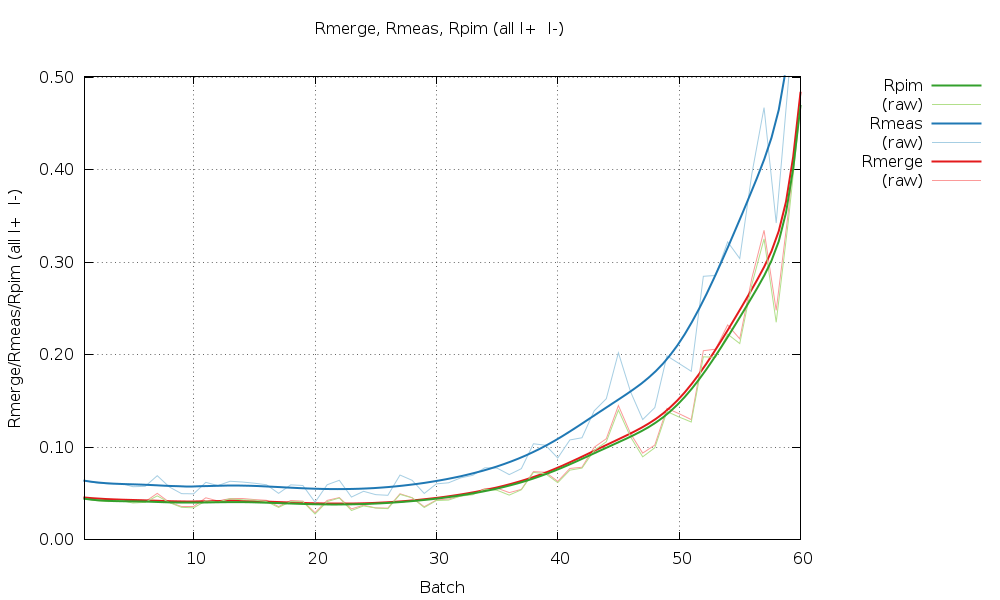
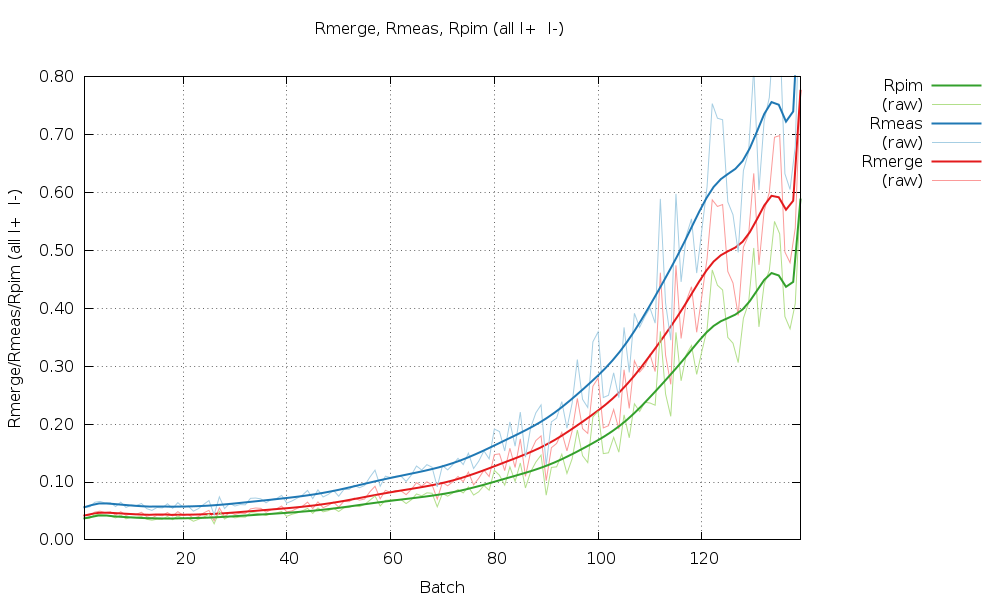
Both sweeps of data show strong indications of radiation damage:
| Sweep | Spots found | R-values |
| 1 | 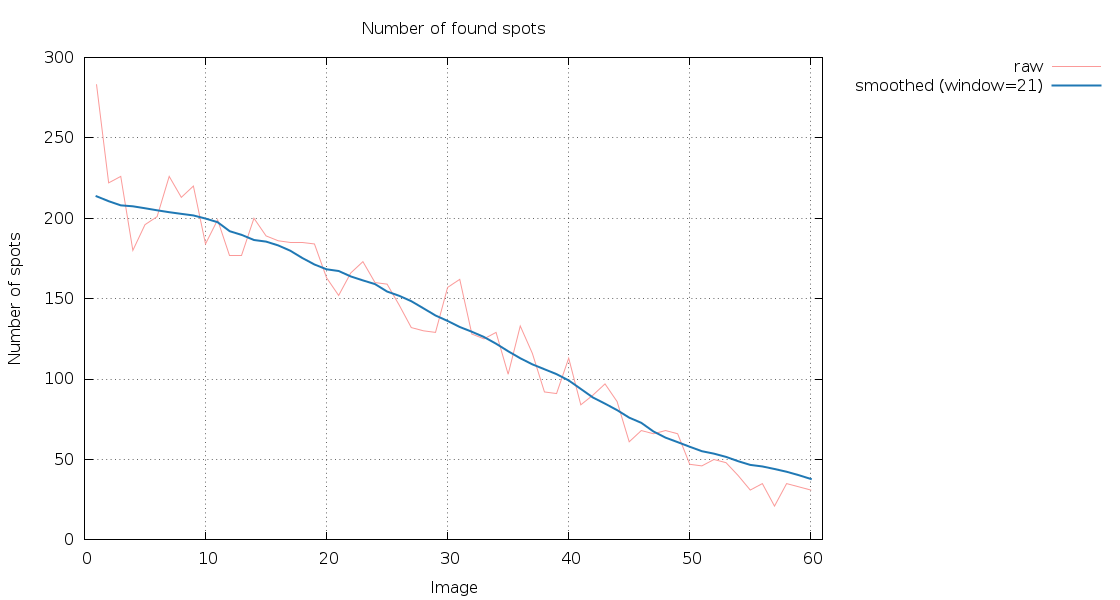 |
 |
| 2 | 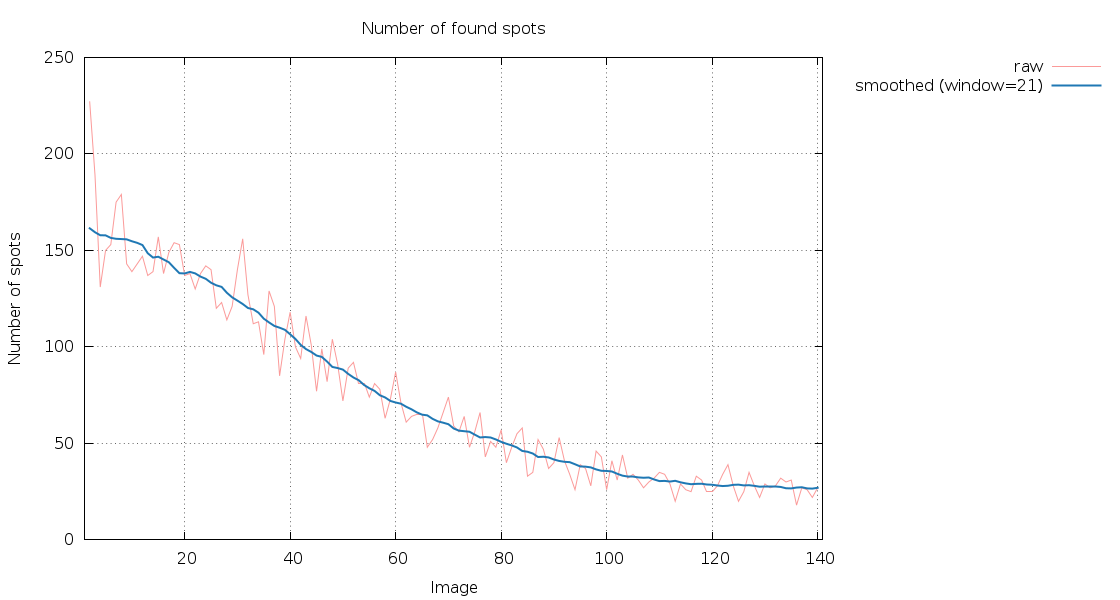 |
 |
If these had been low-dose, high-multiplicity datasets we could have (1) restricted the image ranges to the earlier half for each sweep, or (2) analysed the data for early and late parts (and use those results for F(early)–F(late) radiation-damage detection maps in BUSTER).
The problem with missing data is visible in the STARANISO plots:
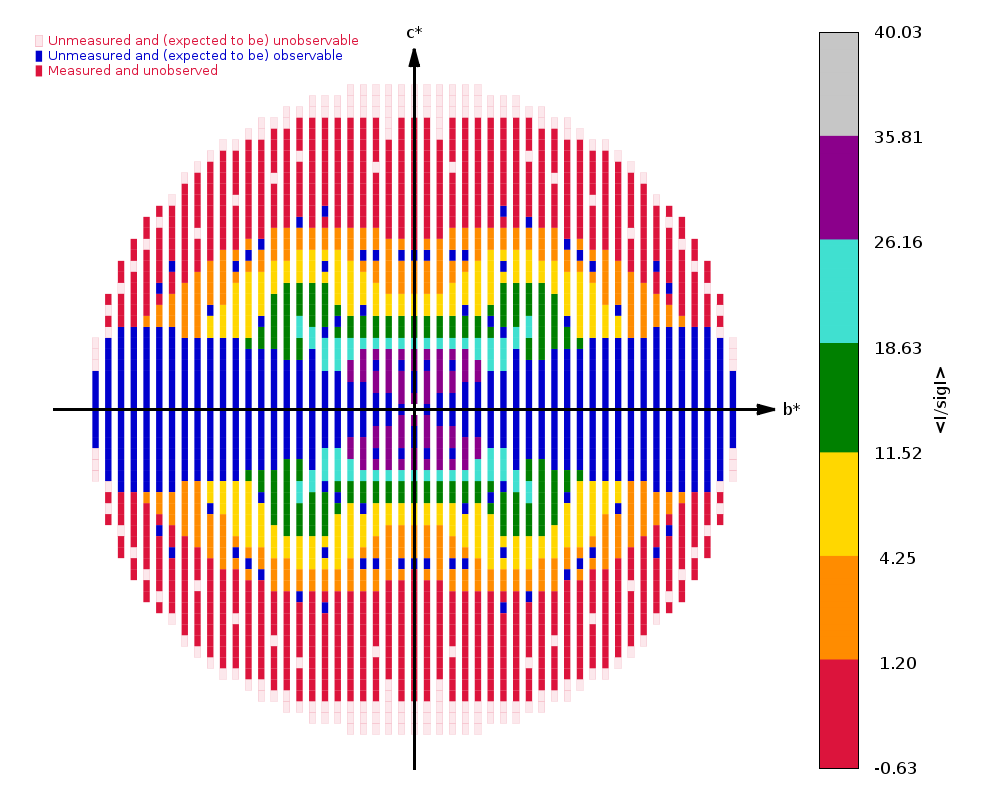 |
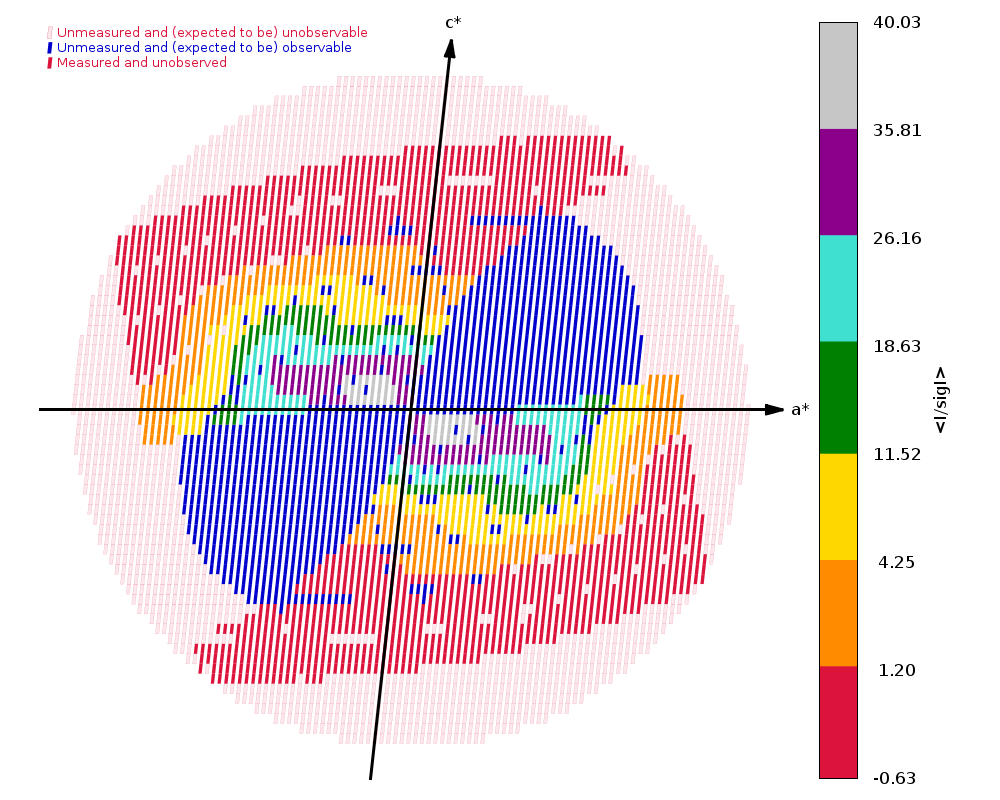 |
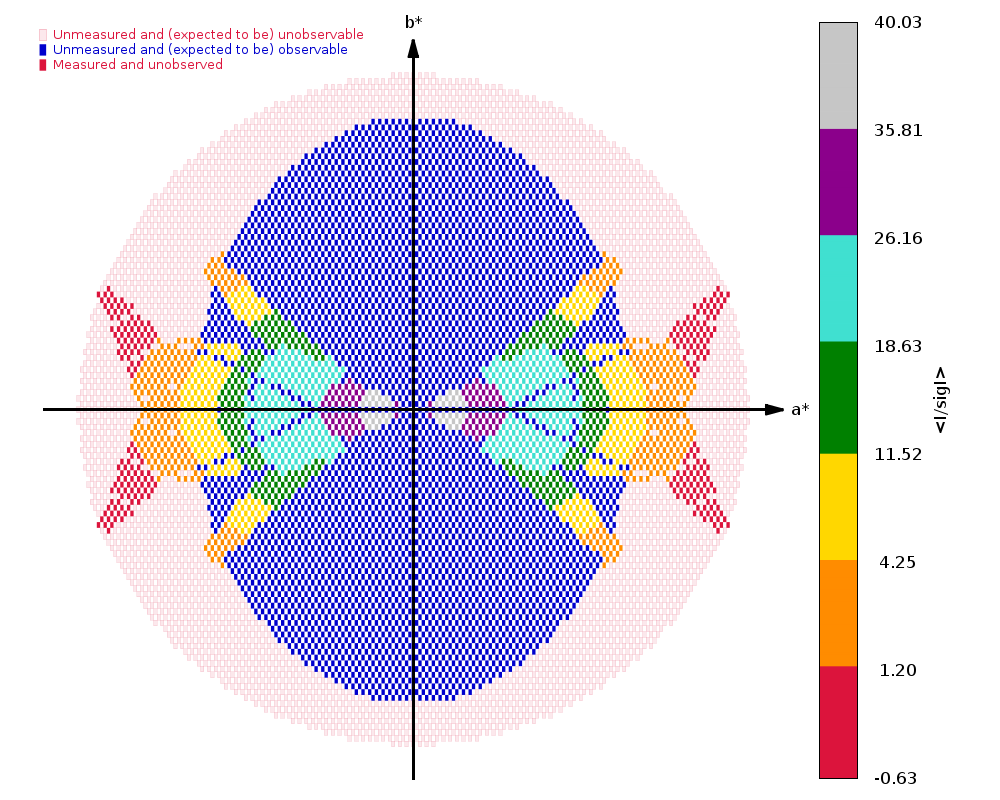 |
and the merging statistics:
anisotropic (STARANISO) analysis:
  Spacegroup name          C2
  Unit cell parameters     190.8751 110.2789 64.2203 90.0000 96.2532 90.0000
  Wavelength               0.97918 A

  Diffraction limits & principal axes of ellipsoid fitted to diffraction cut-off surface:
    2.503         0.7227   0.0000   0.6912       0.962 _a_* + 0.273 _c_*
    2.168         0.0000   1.0000   0.0000       _b_*
    3.488        -0.6912   0.0000   0.7227      -0.933 _a_* + 0.360 _c_*

  Number of active ice-rings within this resolution range =  0

  Number of RUNs (sweeps) contributing to this dataset =   2

  Criteria used in determination of diffraction limits:
  -----------------------------------------------------
     local(I/sigI)  >=    1.20

                                              Overall  InnerShell  OuterShell
  ---------------------------------------------------------------------------
     Low resolution limit                      63.838      63.838       2.571
     High resolution limit                      2.207       6.865       2.207


     Rmerge  (all I+ & I-)                      0.161       0.060       0.637
     Rmerge  (within I+/I-)                     0.141       0.058       0.582
     Rmeas   (all I+ & I-)                      0.197       0.073       0.845
     Rmeas   (within I+/I-)                     0.190       0.078       0.802
     Rpim    (all I+ & I-)                      0.110       0.040       0.547
     Rpim    (within I+/I-)                     0.126       0.053       0.548
     Total number of observations               56301        3992        1823
     Total number unique                        20852        1408         849
     Mean(I)/sd(I)                                8.8        26.3         1.5
     Completeness (spherical)                    31.4        61.6         3.5
     Completeness (ellipsoidal)                  47.2        61.6         8.4
     Multiplicity                                 2.7         2.8         2.1
     CC(1/2)                                    0.983       0.994       0.428
traditional (isotropic) analysis:
                                              Overall  InnerShell  OuterShell
  ---------------------------------------------------------------------------
     Low resolution limit                      51.754      51.754       2.697
     High resolution limit                      2.652       7.192       2.652


     Rmerge  (all I+ & I-)                      0.205       0.057       1.264
     Rmeas   (all I+ & I-)                      0.251       0.070       1.785
     Rpim    (all I+ & I-)                      0.142       0.040       1.261
     Total number of observations               64946        3441        1130
     Total number unique                        25685        1226         961
     Mean(I)/sd(I)                                6.7        29.5         0.9
     Completeness                                66.8        62.0        50.0
     Multiplicity                                 2.5         2.8         1.2
     CC(1/2)                                    0.975       0.994       0.370
For comparison the values from the deposited structure (as available):
                                              Overall  InnerShell  OuterShell
  ---------------------------------------------------------------------------
     Low resolution limit                      43.680      43.680       2.750
     High resolution limit                      2.700       7.320       2.700


     Rmerge  (all I+ & I-)                      0.140       0.060       0.637
     Rmeas   (all I+ & I-)                      0.173       0.071       0.769
     Rpim    (all I+ & I-)                      0.099       0.040       0.492
     Total number unique                        20799        1163         679
     Mean(I)/sd(I)                                4.9          NA          NA
     Completeness                                57.3        62.6        38.4
     Multiplicity                                 2.5         2.9         1.9
     CC(1/2)                                       NA       0.991       0.566
These show better R-values (but poorer <I/sigma(I)> values) and lower completeness: so maybe some images (towards the end of each sweep where radiation damage becomes very pronounced) were exclued? This would also explain the better R-values (but not the lower <I/sigma(I)> value).