Please also check the latest information at ComparisonProcessing202504
(see also subsequent investigation and previous one)
Update 20250331: The latest XDS binary (20250327) runs on all Linux systems we have access too (including older CentOS7 boxes) and behaves very similarily to the 20230630 version. For details see here
Update 20250326: A latest XDS binary (provided to us for testing) shows again a normal histogram and no detectable bias - so seems to behave very similarily to 20230630 again. The Wilson plots show near identical behaviour to the 20230630 version too.
Update 20250325: Added Wilson plots for different versions.
Update 20250323: Further analysis regarding "misfits" along module gaps (and other "marked" pixels).
Update 20250321: started testing of latest 20250320 XDS binary and adding comparison/results to the relevant sections here.
Content:
- Introduction
- Regression regarding automatic exclusion of poor image ranges
- Apparent bias in integrated intensities
- Comparison using 60 example datasets
- Problem computing initial background around marked/masked pixels
Introduction
A new XDS version has been released (20250119) and the binaries for our previous recommendation (to use the 20230630 version) are no longer available. We will analyse that latest version and report our findings here asap.
See also previous analysis.
Regression regarding automatic exclusion of poor image ranges
Update-20250311: XDS built 20250224 fixes this particular issue
The 20250119 XDS version shows a regression regarding the EXCLUDE_DATA_RANGE= keyword within the INTEGRATE stage: the desired handling of those excluded image ranges seems to be ignored, resulting in an error:
 IMAGE IER    SCALE     NBKG NOVL NEWALD NSTRONG  NREJ   SIGMAB   SIGMAR
 !!! ERROR !!! "PROCBAT": UNDEFINED DIRECT BEAM
(after the previous DELPHI block was without any data because all images are defined as being excluded). We reported that problem to the XDS developers on 17th Feb 2025.
See also our known issues page for potential (sub-optimal) work-arounds.
Apparent bias in integrated intensities
Using simulated data generated with our SIMCAL software (where one knows the intensity values for each reflection spot), Gleb Bourenkov (EMBL-HH, P14) did some detailed analysis to check for possible bias introduced with the latest XDS versions using simulated diffraction data. The advantage of this approach is that diffraction images are generated with uniform, defined noise, which allows a confident and unequivocal definition of the "ground truth". In the table, the I(simu) is an average number of photons per reflection that we put on the image, and the averaging is in resolution shells. The background here is 4 photons/pixel (in this case). I(2023), I(2024) and I(2025) are the corresponding intensity averages derived from the INTEGRATE.HKL output files of the respective XDS versions (2023=20230630, 2024=20241002 and 2025=20250119). These are integrated intensities "descaled" as described in the XDS documentation: IOBS=I*RLP/(PEAK/100). In this way, the integration was carried out with constant geometric parameters for all three runs using different versions (same XPARM.XDS), REFINE(INTEGRATE) =!, and fixed scaling factors: DATA_RANGE_FIXED_SCALE_FACTOR= 1 3600 1.0 .
Res   I(simu)  I(2023)  I(2024)  I(2025/01)  I(2025/02)  I(20250320)
---------------------------------------------------------------------
2.93  20439.8  21535.1  21640.4   21577.4      21944.8     21965.7
2.56   5257.5   5532.1   5587.2    5545.6       5676.1      5690.6
2.33   2056.9   2157.9   2196.5    2188.2       2238.4      2248.9
2.16   1007.1   1056.5   1088.1    1082.7       1109.8      1119.3
2.03    467.1    481.3    507.3     504.7        519.8       528.3
1.93    230.6    230.9    250.6     249.1        255.7       263.6
1.85    109.5    107.2    118.8     117.0        119.4       127.2
1.77     57.9     56.3     62.7      60.0         61.3        69.2
1.71     28.7     27.5     30.7      26.9         26.9        34.8
1.66     17.4     17.0     19.2      14.2         14.1        22.5
1.61     10.6     10.3     11.7       6.0          5.6        14.4
1.57      6.6      6.5      7.7       1.6          0.9         9.8
1.53      4.3      4.2      5.2      -1.5         -2.3         6.9
1.50      2.8      2.6      3.6      -3.5         -4.4         5.0
1.47      1.7      1.7      3.0      -4.2         -5.1         4.4
1.44      1.2      1.0      1.9      -5.5         -6.6         3.3
1.41      0.8      0.7      1.6      -6.3         -7.3         3.1
1.38      0.6      0.6      1.7      -5.9         -7.0         3.5
1.36      0.5      1.0      1.5      -6.7         -8.2         3.4
(each intensity column shows the average within that resolution bin).
Whereas I(simu) is reproduced perfectly by the 20230630 version, the 20250119 version produces excessive amounts of negative intensities in low-intensity resolution shells, which are obviously incorrect. The 20241002 version, on the other hand, produces intensities that are systematically higher than the ground truth. At first glance, the excess may appear small compared to noise, but it is systematic and with high multiplicity will propagate into final scaled and merged data sets.
We qualitatively observe similar outputs from the three XDS versions when integrating experimental data that were collected with the detector set close enough to fully capture the intensity fall-off. The positive bias that we observe in the 20241002 version is well consistent with the earlier analysis which indicated (1) systematically higher resolution compared to 20233006 and (2) a frequent occurrence of erroneous twinning detection. The latter is a likely result of skewed intensity distributions. In other real-life experimental data, that are predominantly very high-resolution, high-energy, and high-multiplicity data, we see an overestimation of resolution limits in almost every data set with the 20241002 version.
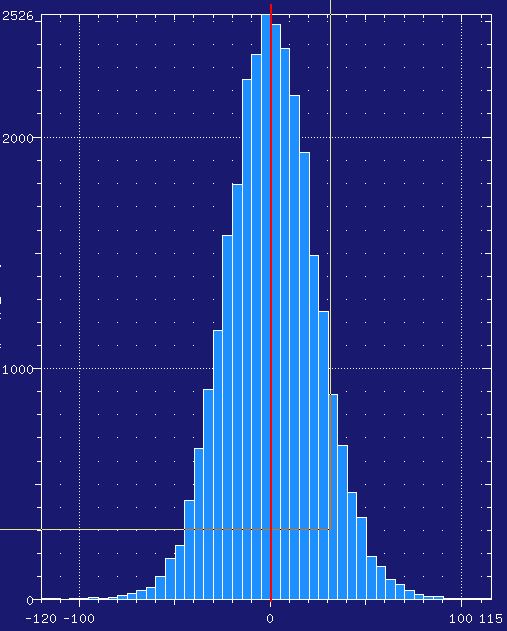
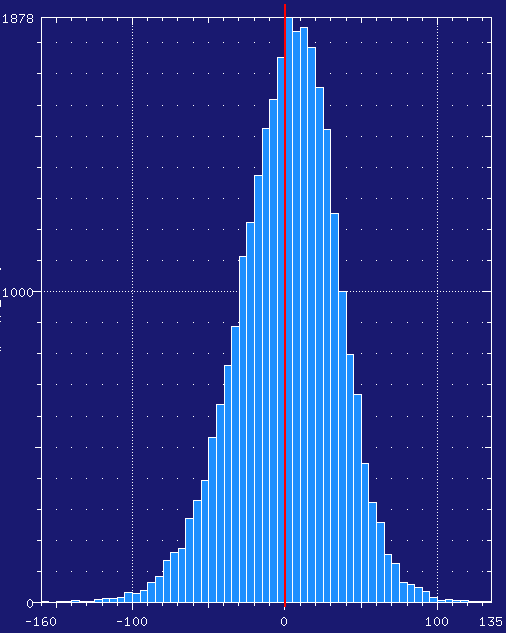
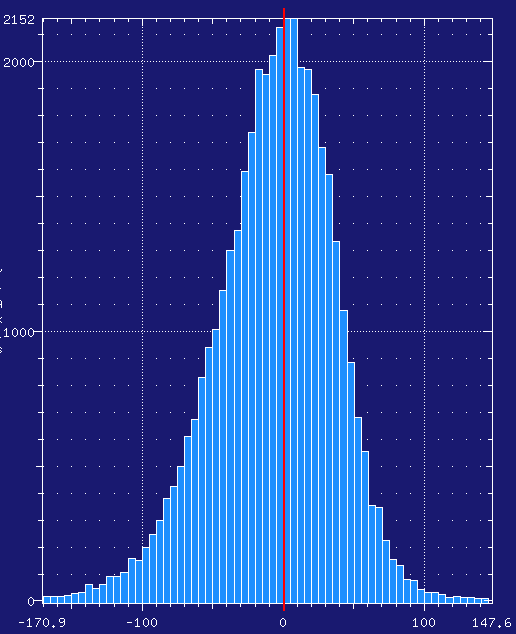
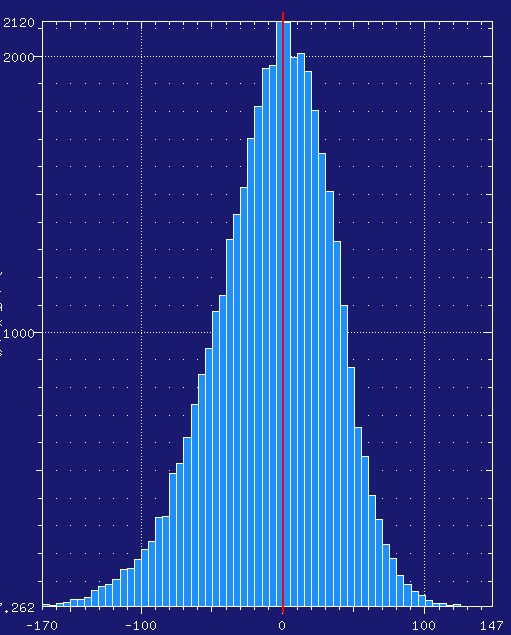
For an illustration, the histograms of integrated intensities in the 1.41 - 1.36 A shell for simulated data sets processed with XDS versions 2023, 2024 and 2025 are shown below:
| 2023 | 2024 | 20250119 | 20250224 | 20250320 |
 |
 |
 |
 |
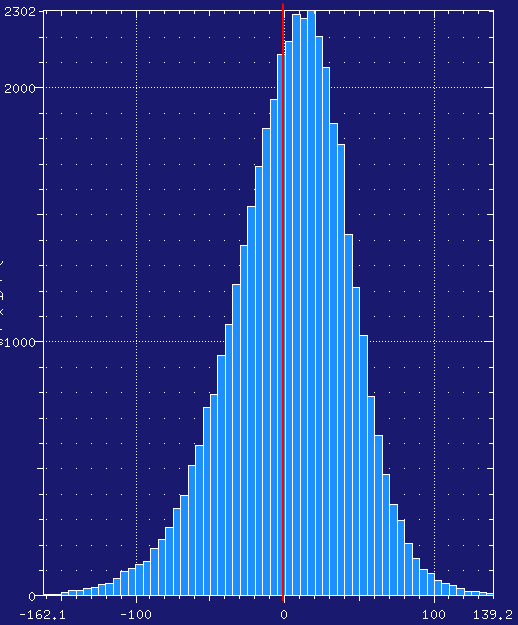 |
The 2023 histogram appears perfectly symmetrically Gaussian centered at zero as expected, while the 2024 histogram is skewed towards positive values (as also visible in the above table over a fuller resolution range). The 2025 histograms look as if they still have an issue with the mode shifted to positive values (like the 2024 version), but also showing a huge negative tail. The magnitude of that bias seems to have increased, as has the skewness for the 20250320 version.
Comparison using 60 example datasets
This is using the same 60 datasets as for the previous comparison: running identical autoPROC jobs with (1) only changing the XDS version, and (2) no automatic exclusion of image ranges.
- versions used are: 20230630, 20241002, 20250119, 20250224 and 20250320
- 8SLU is really poor if all images are processed
- all work with 20230630 (as in: run to the end without error)
- 8E5V and 8E60 only work with 20230630
- 8EPS fail in AIMLESS scaling for 20250224
- 8SO5 fail in XDS/CORRECT for 20250119
So we will exclude those 5 datasets and look only at the 55 where all versions run to the end and compare the newer XDS versions relative to 20230630:
- number of misfits assigned in XDS/CORRECT:
- 20241002 gives on average ca 18% fewer
- 20250119 gives on average ca 89% more
- 20250224 gives on average ca 82% more
- 20250320 gives on average ca 11% fewer
- Wilson B from XDS/CORRECT:
- 20241002 gives on average ca 20% lower value
- 20250119 gives on average ca 27% higher value
- 20250224 gives on average ca 27% higher value
- 20250320 gives on average ca 16% lower value
- ISa from XDS/CORRECT:
- 20241002 gives on average ca 11% higher value
- 20250119 gives on average ca 7% higher value
- 20250224 gives on average ca 9% higher value
- 20250320 gives on average ca 10% higher value
- Twin fraction (alpha) from feeding XDS_ASCII.HKL into POINTLESS:
- 20241002 gives on average an increase of 0.03
- 20250119 gives on average an increase of 0.02
- 20250224 gives on average an increase of 0.02
Misfits/outliers classified by XDS/CORRECT
Comparing the assigned misfits across all datasets and versions:
- as a function of detector position
- module gaps marked by thin black lines
- misfits colored by intensity (log-scale)
- click on picture for a larger version
| 4FQN | 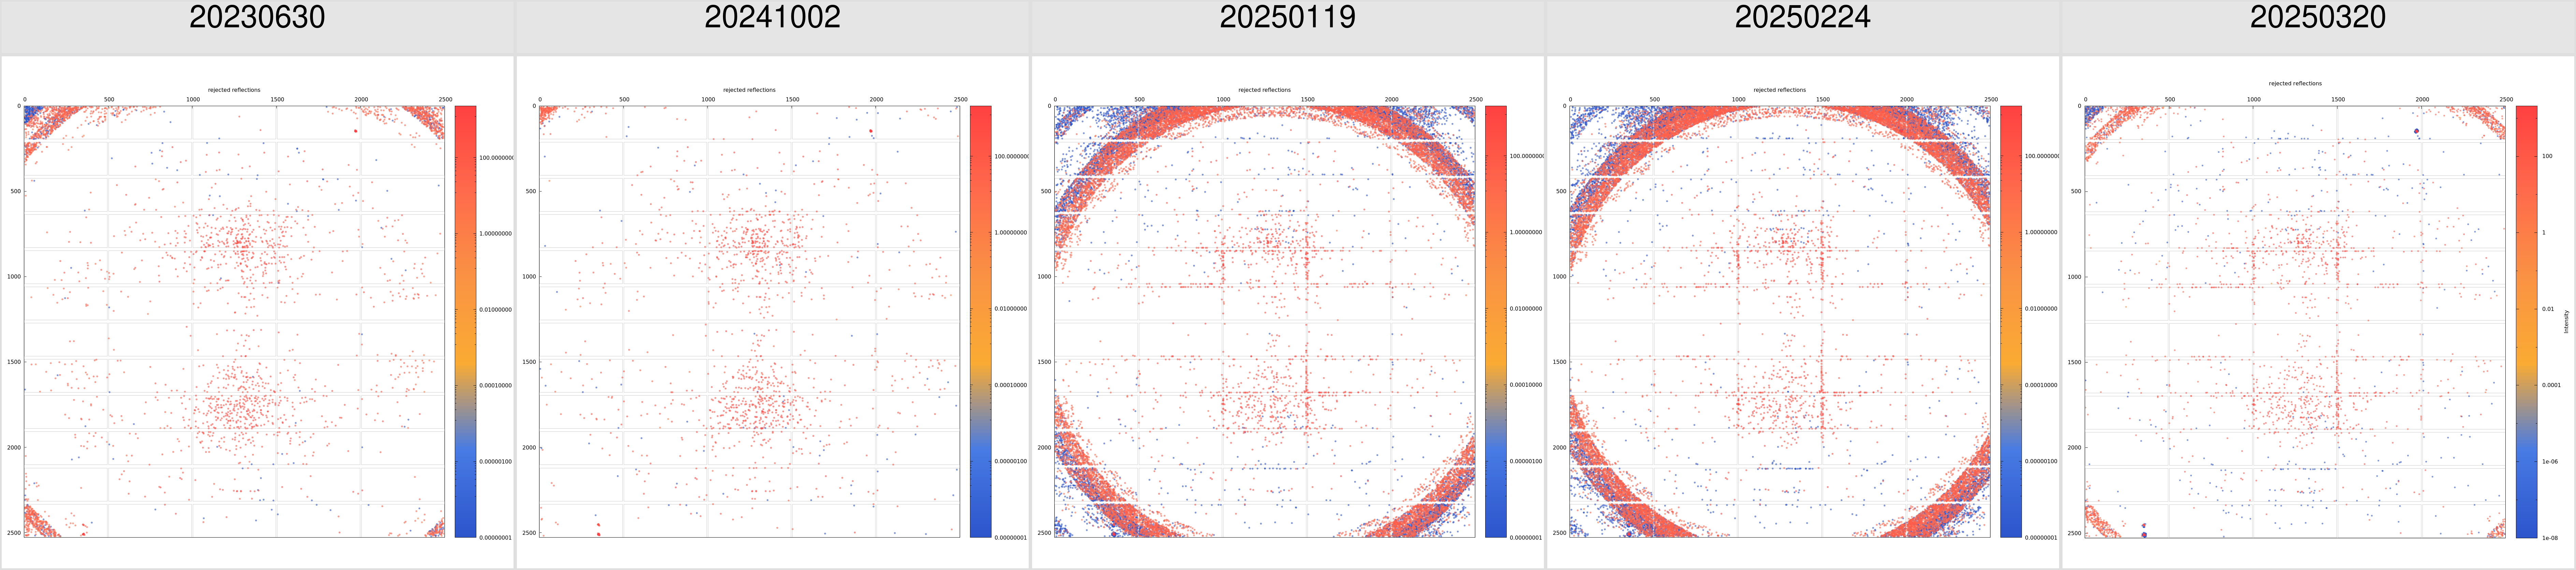 |
| 4QKI | 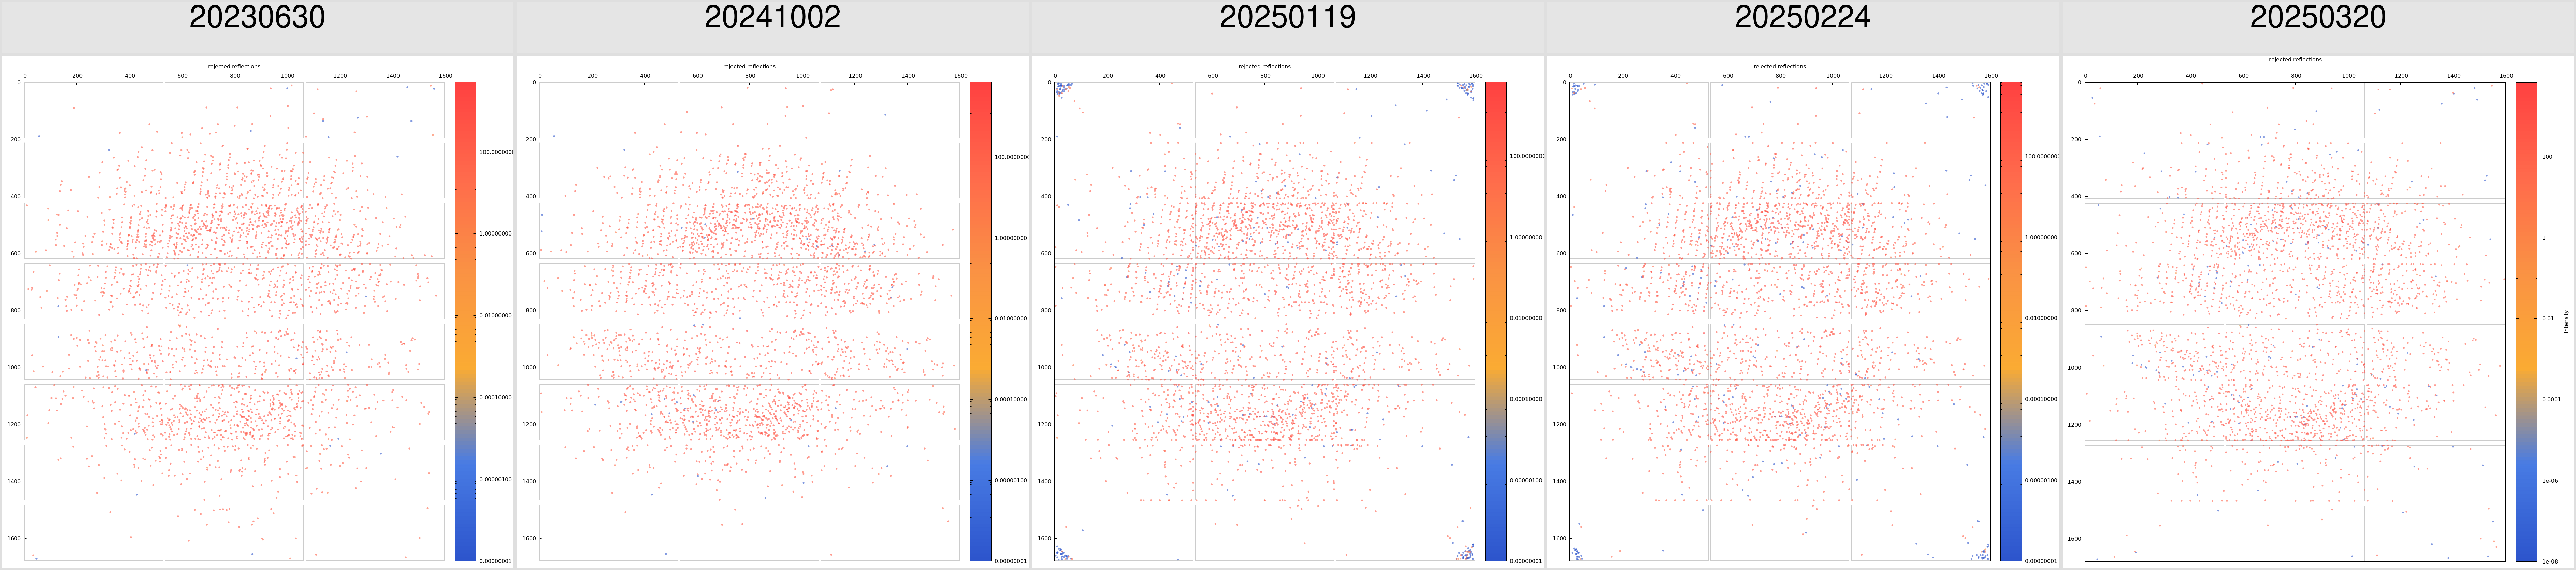 |
| 5AUI | 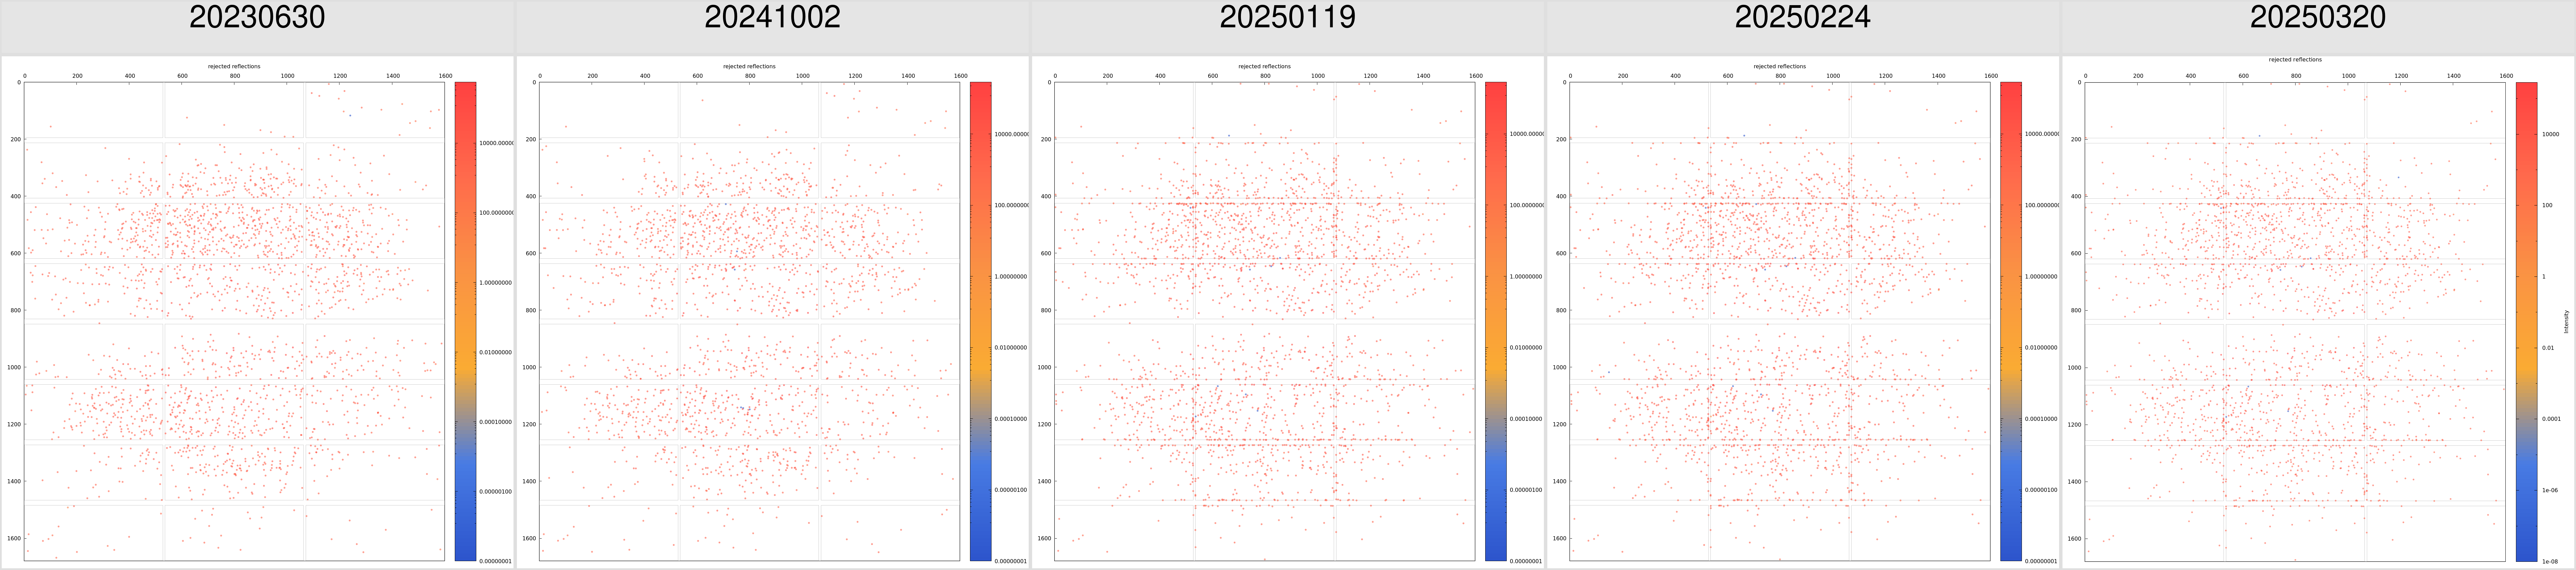 |
| 5E9I | 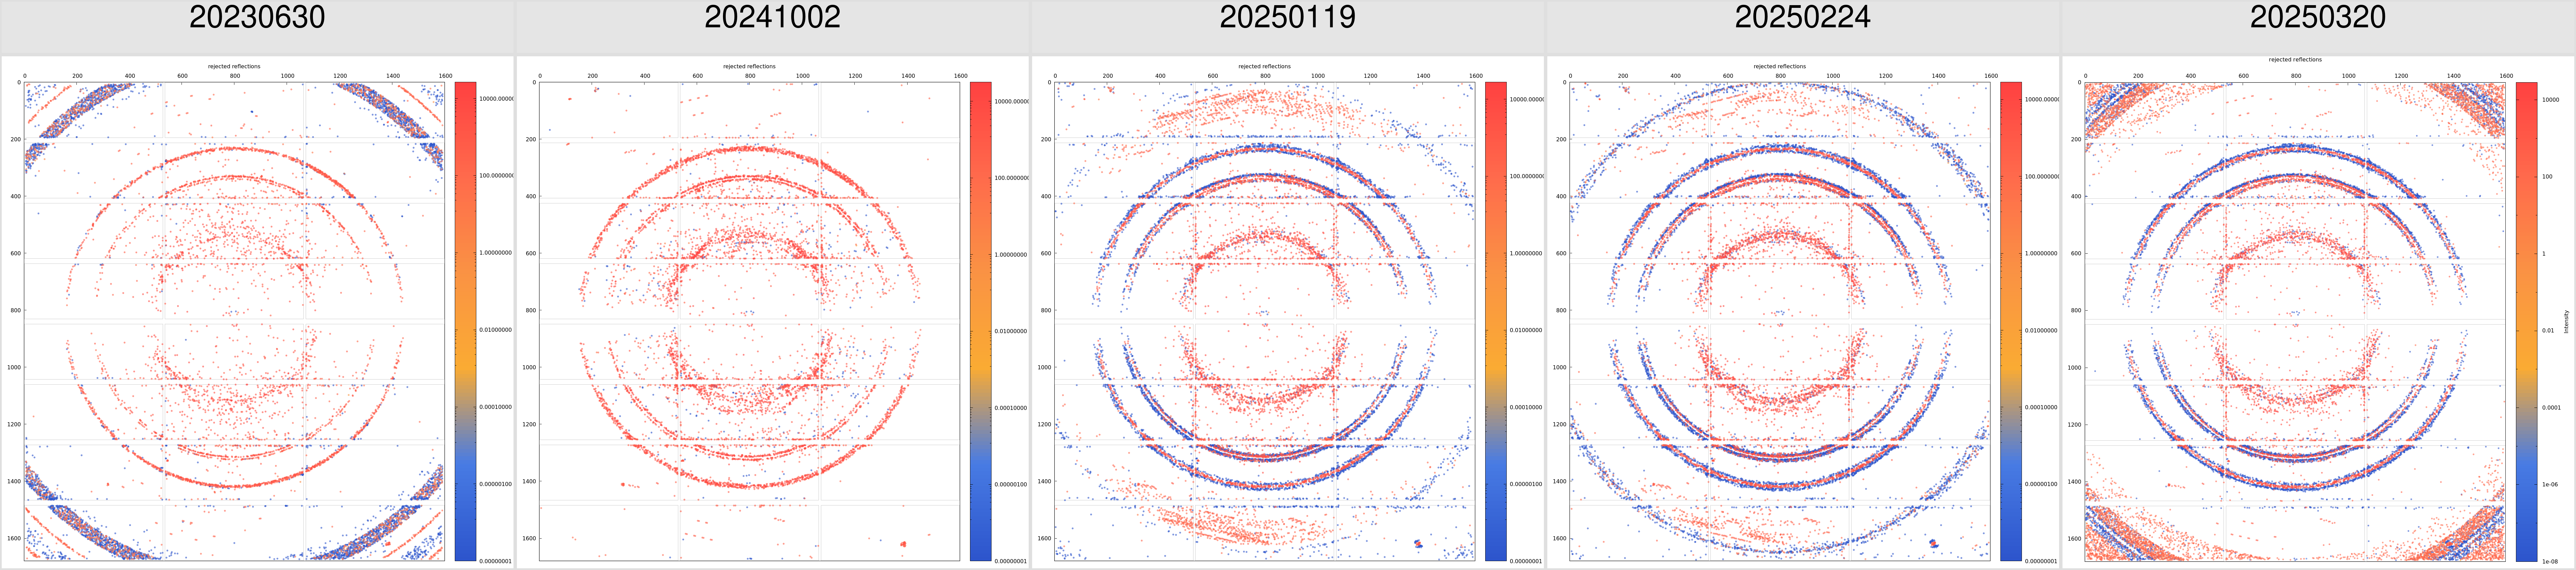 |
| 5FBO | 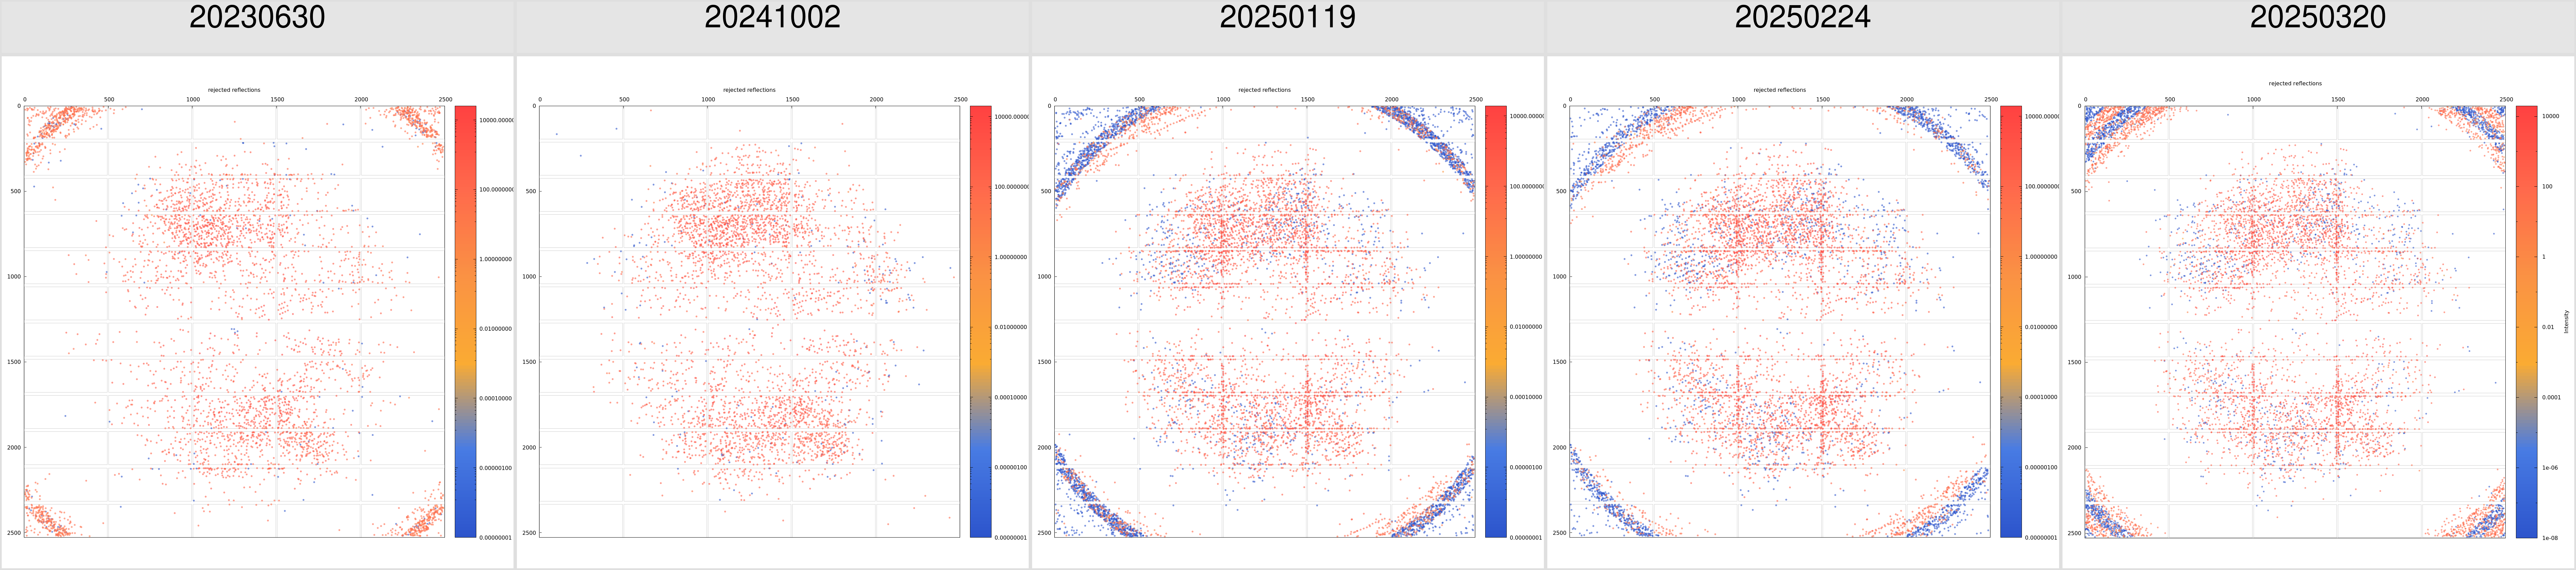 |
| 5OD9 | 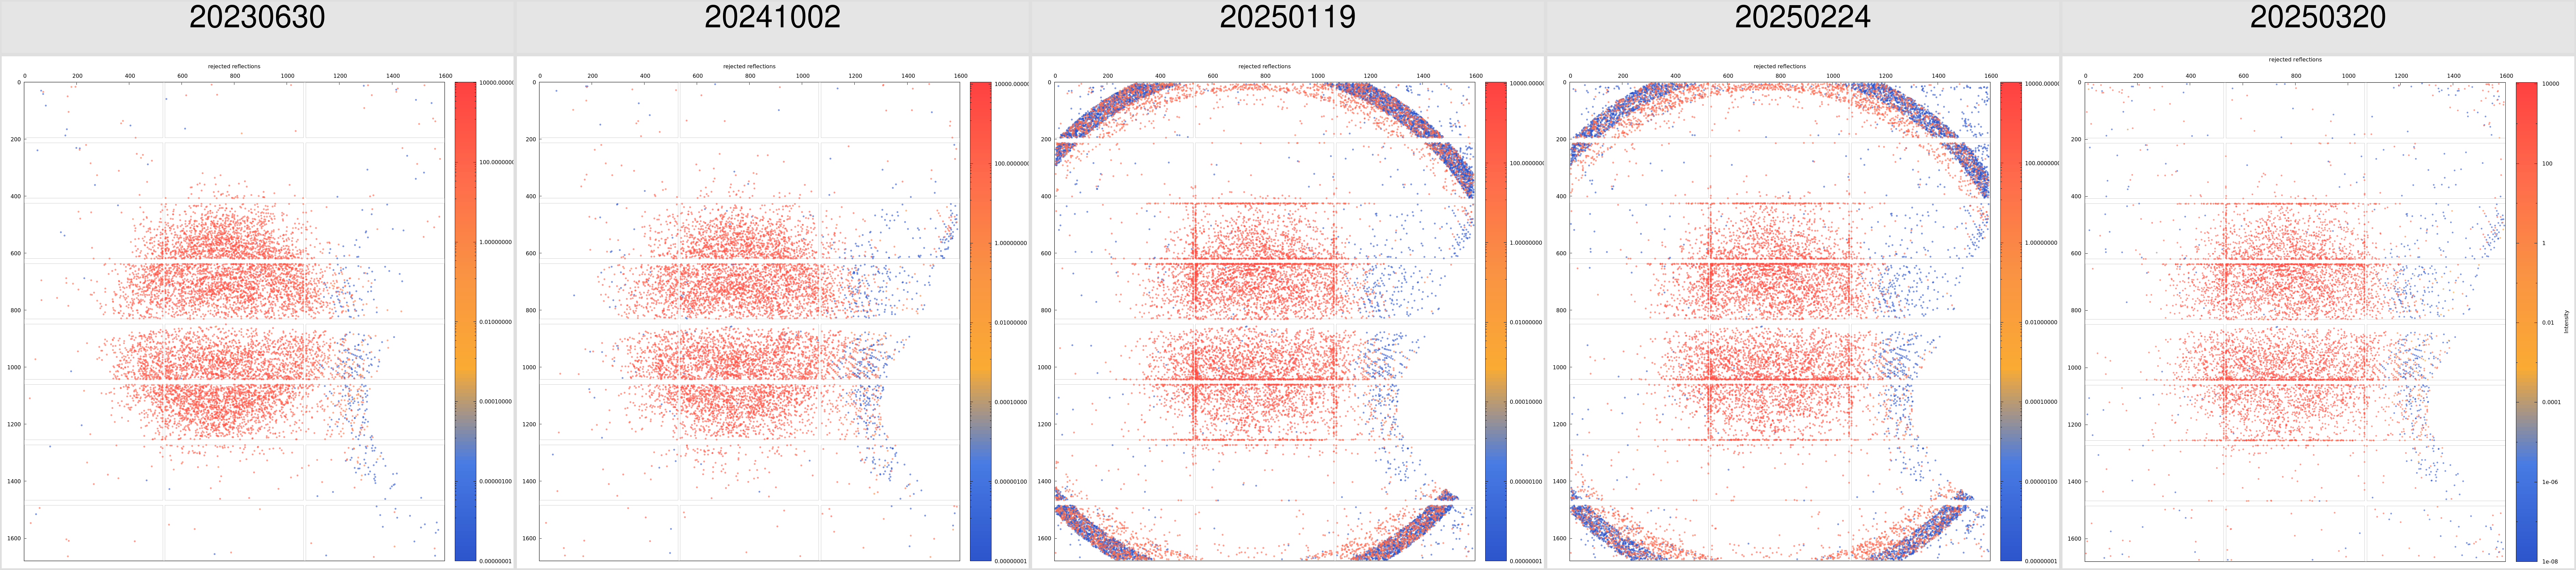 |
| 5ONZ | 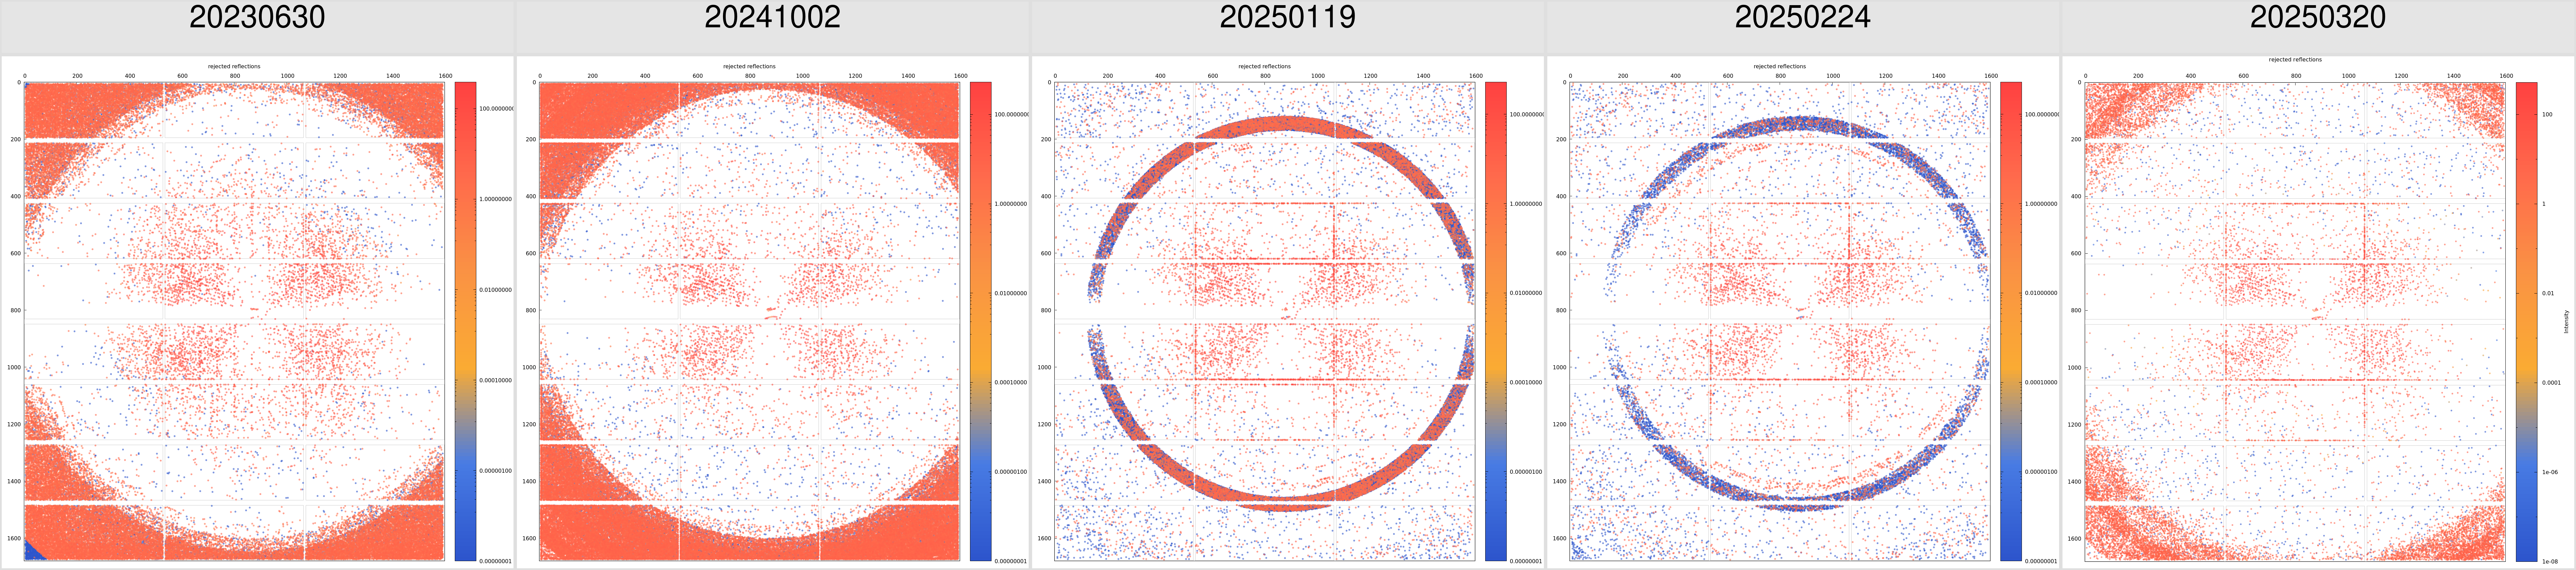 |
| 5RG0 | 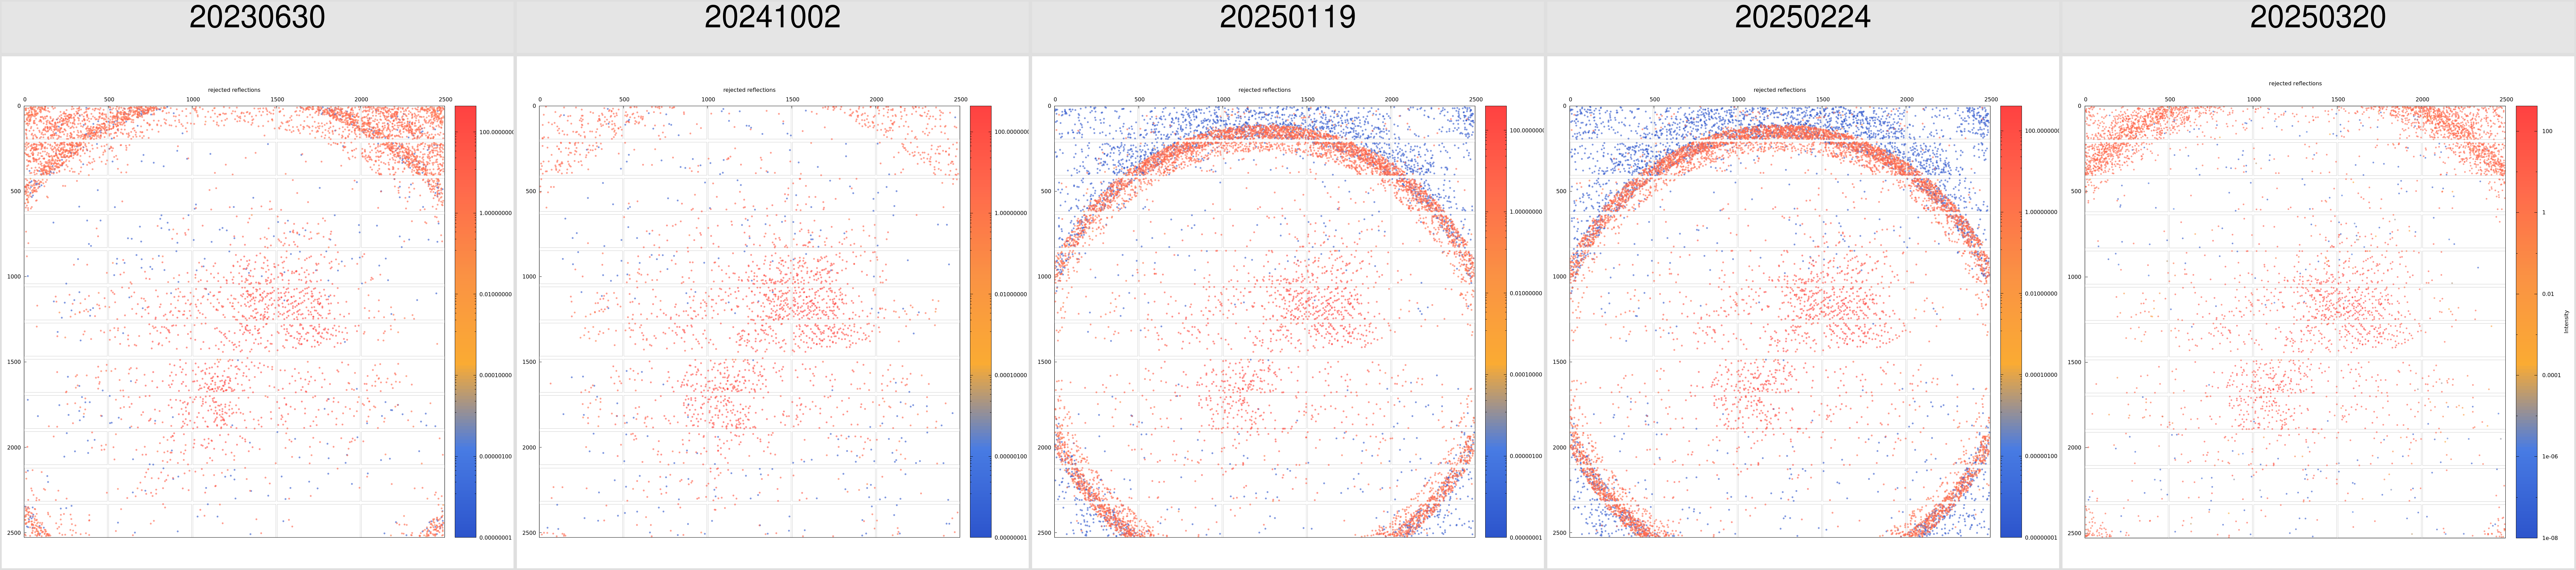 |
| 5SP6 | 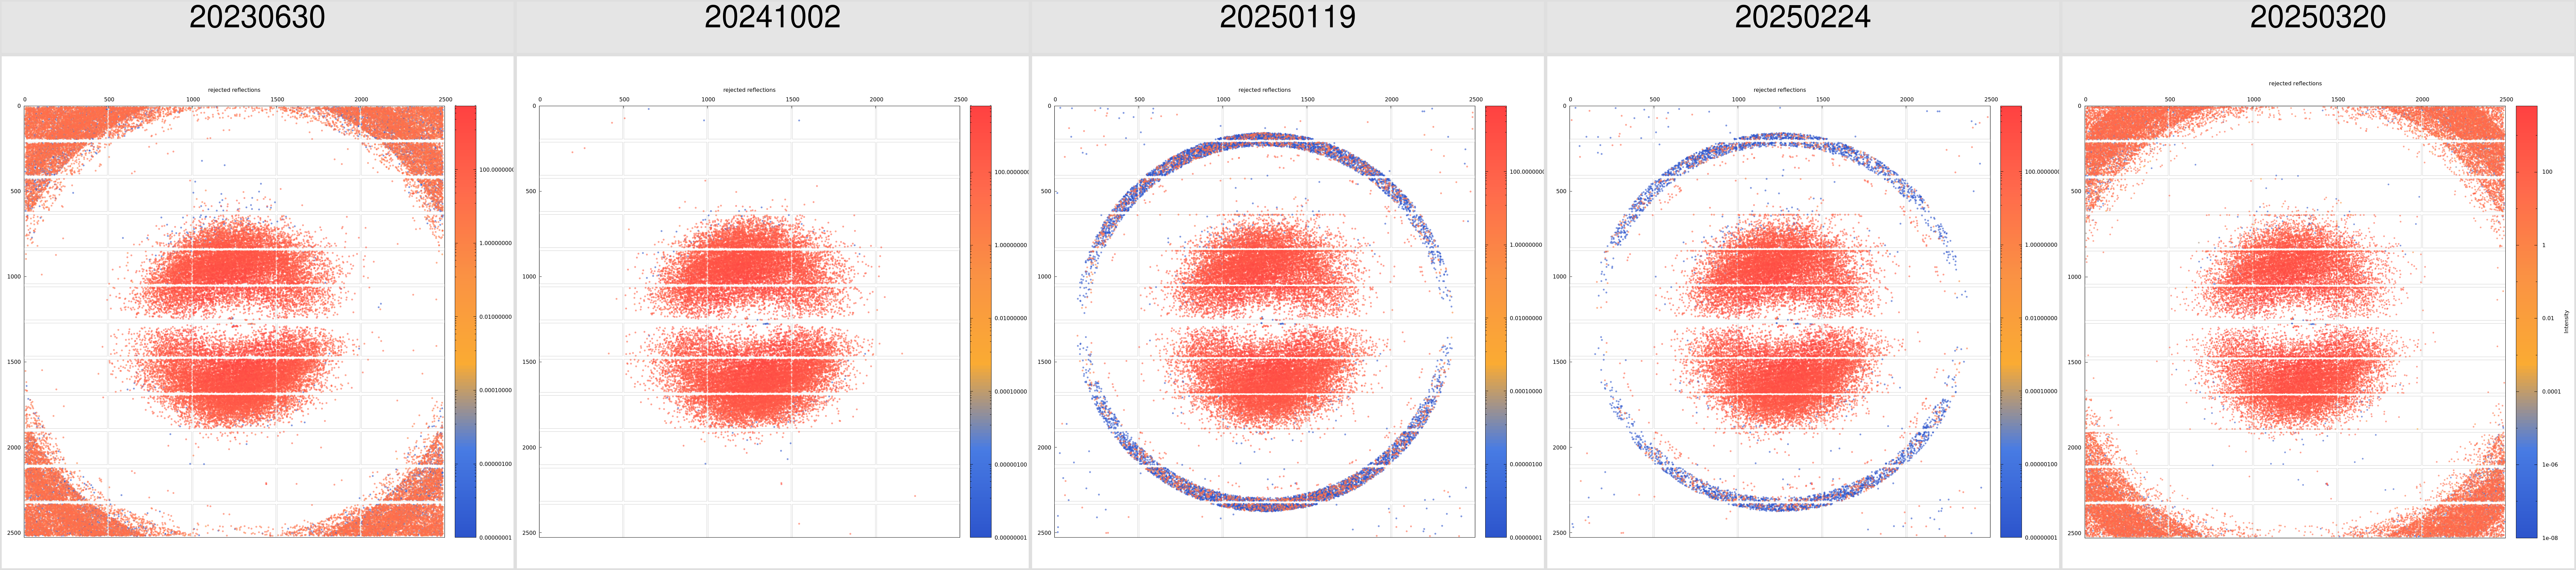 |
| 5VZR | 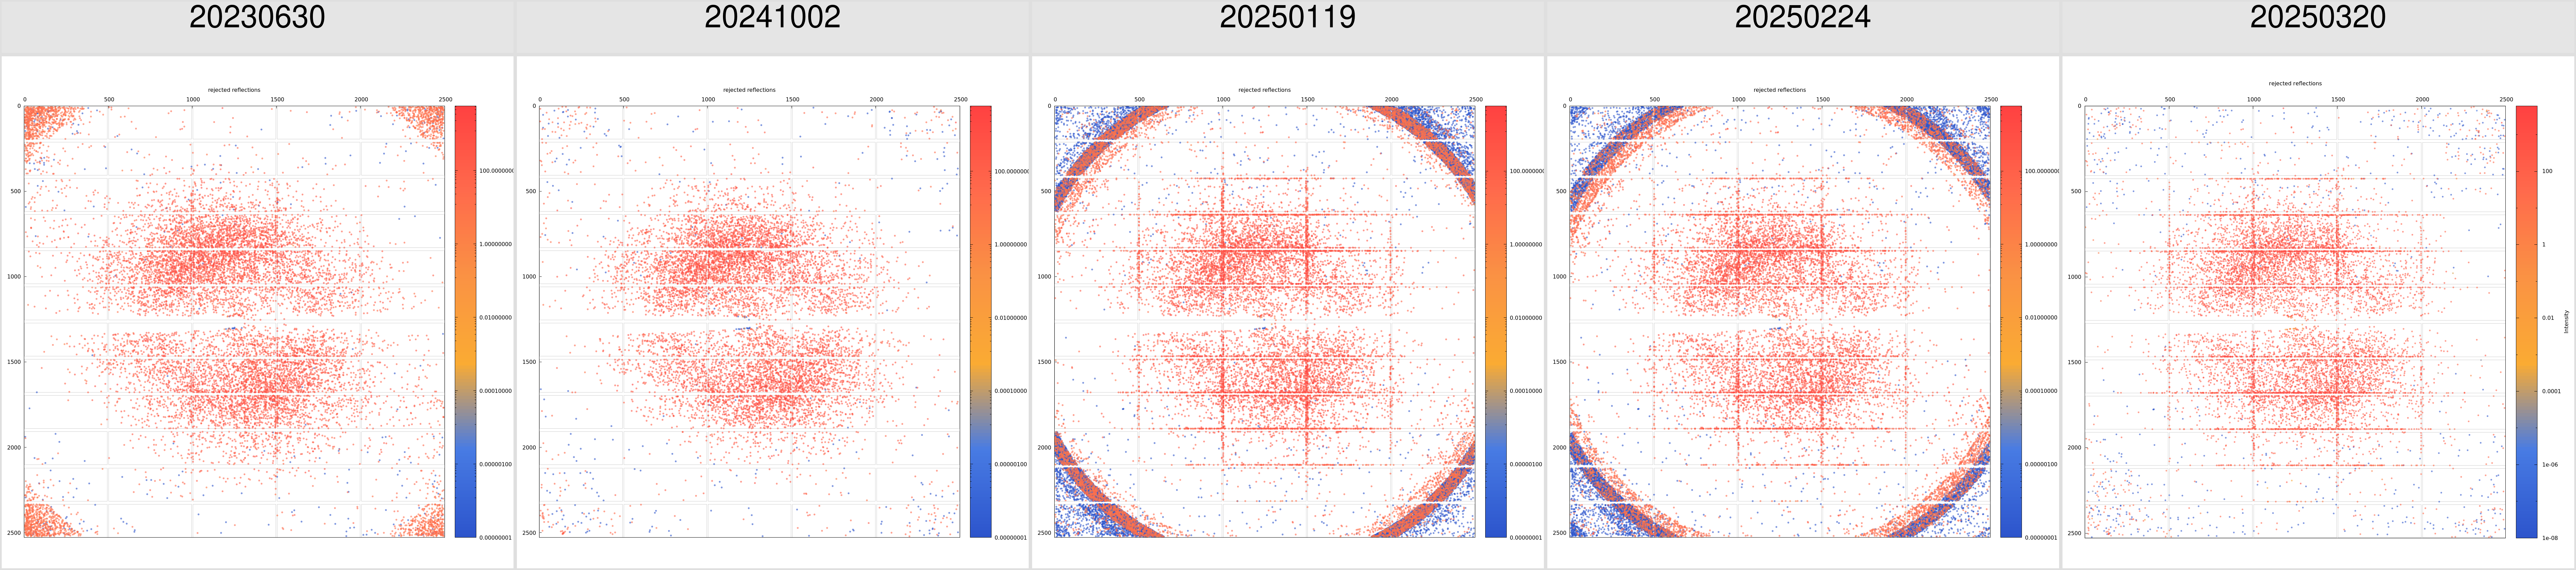 |
| 6BLI | 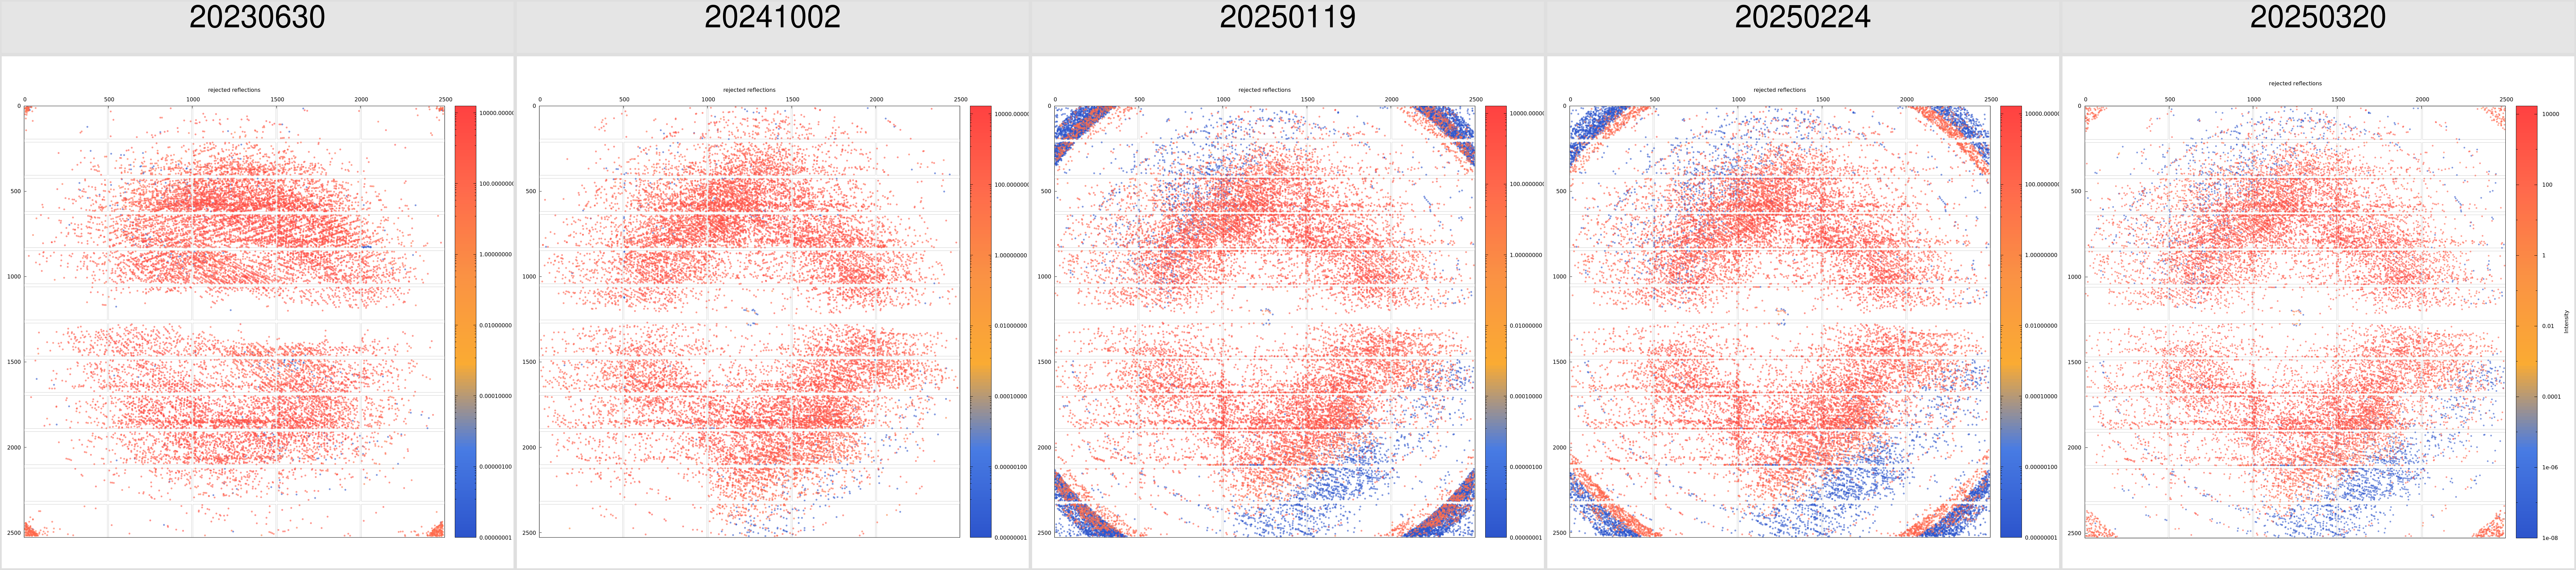 |
| 6CK7 | 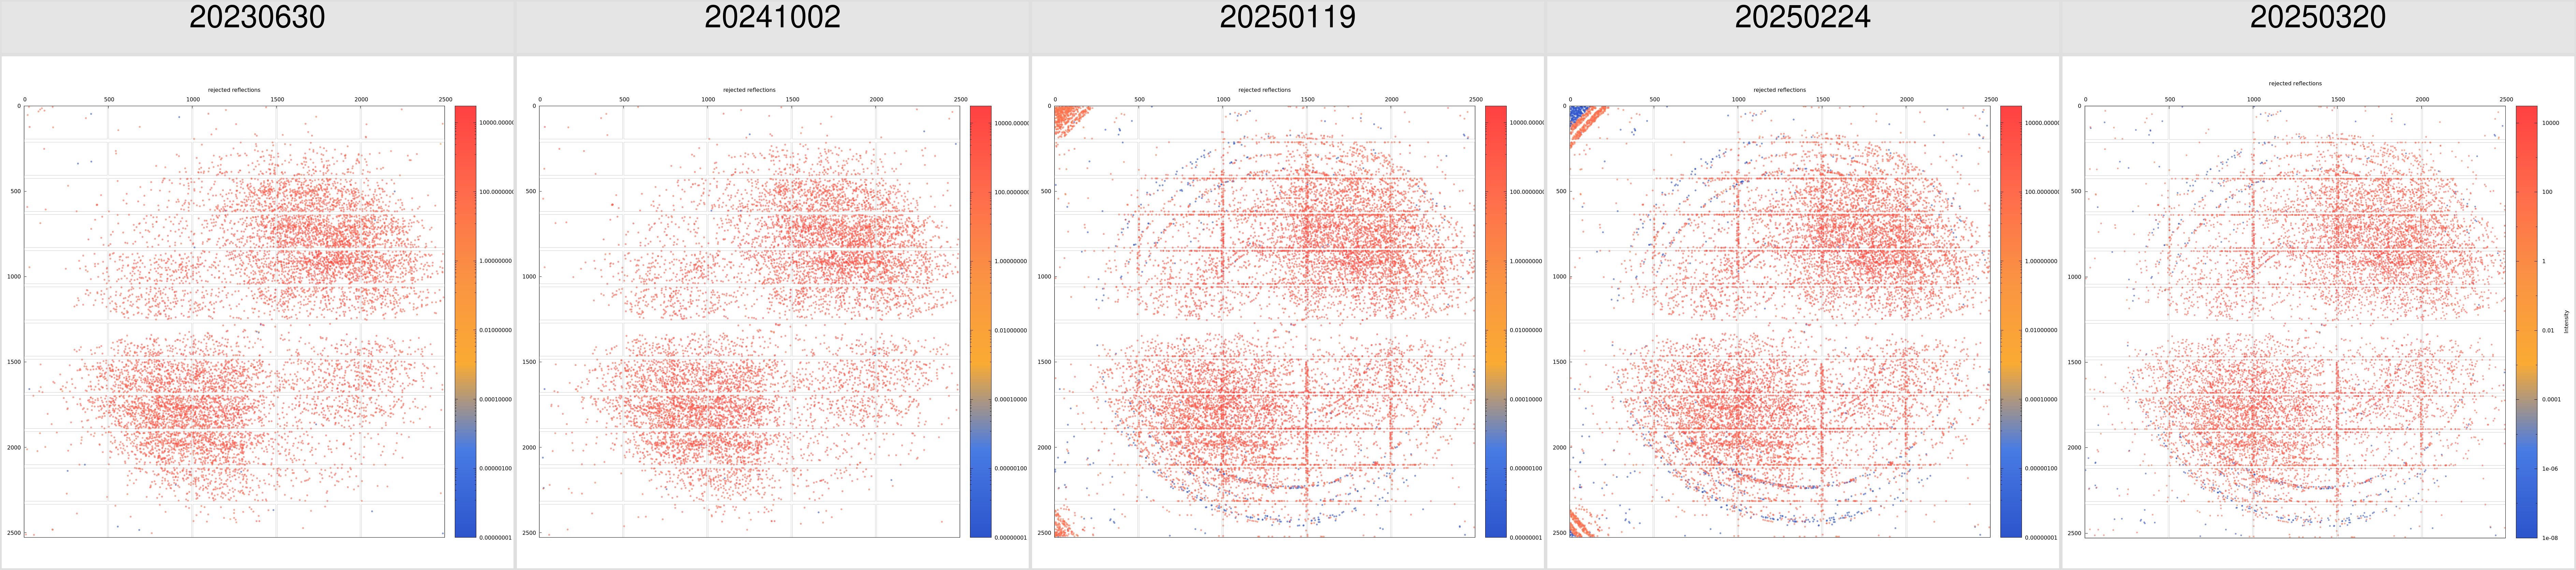 |
| 6CW0 | 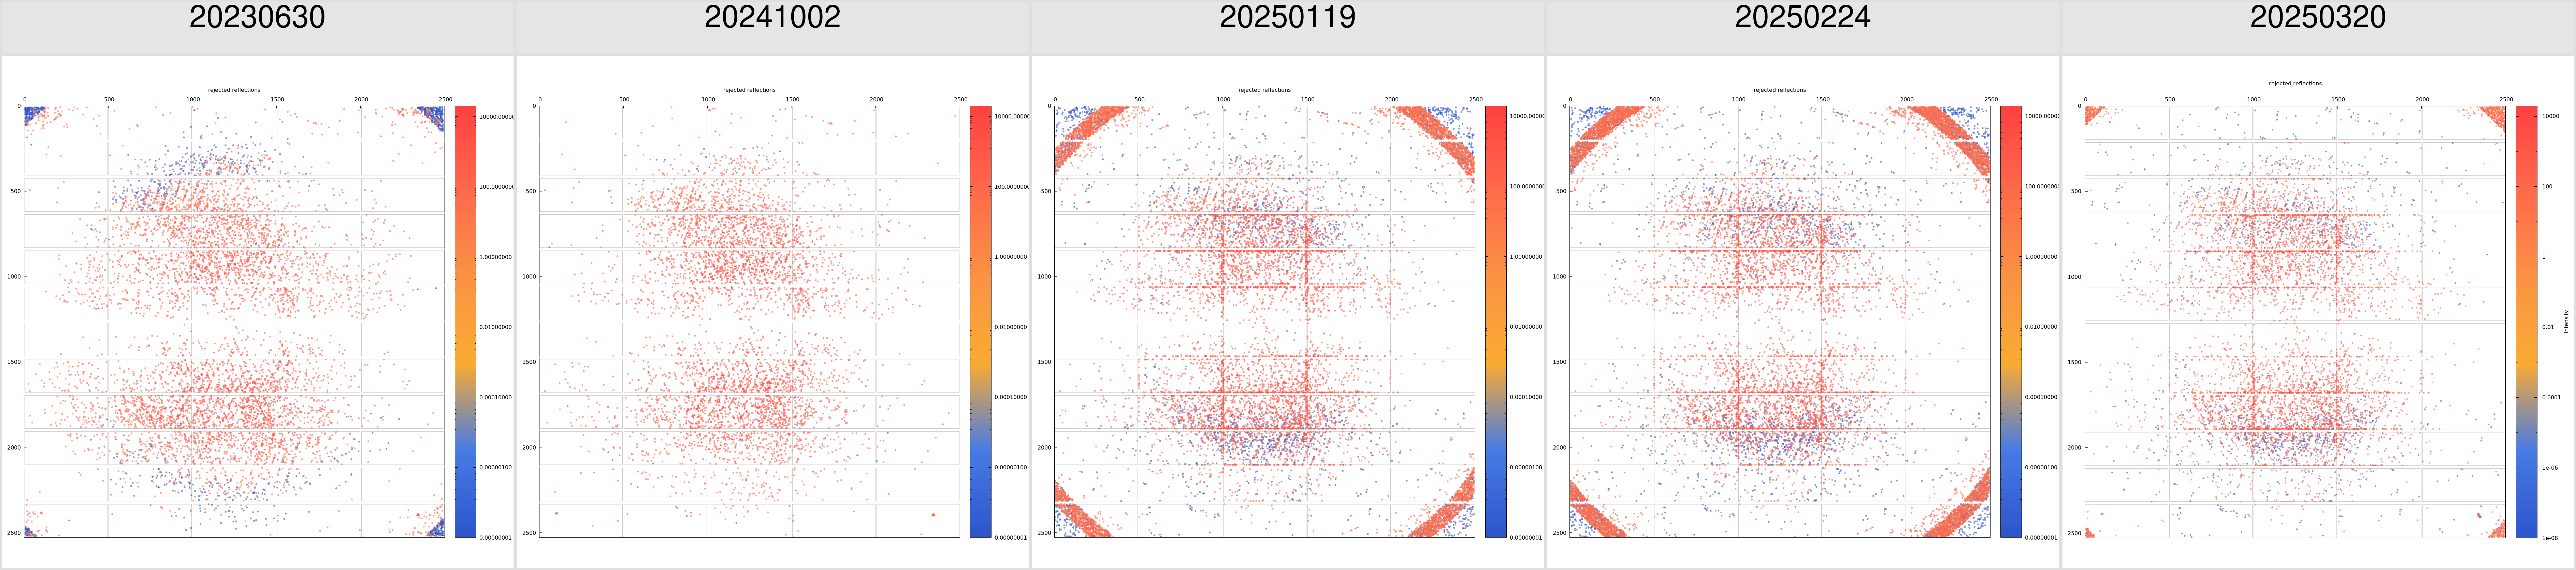 |
| 6DEX | 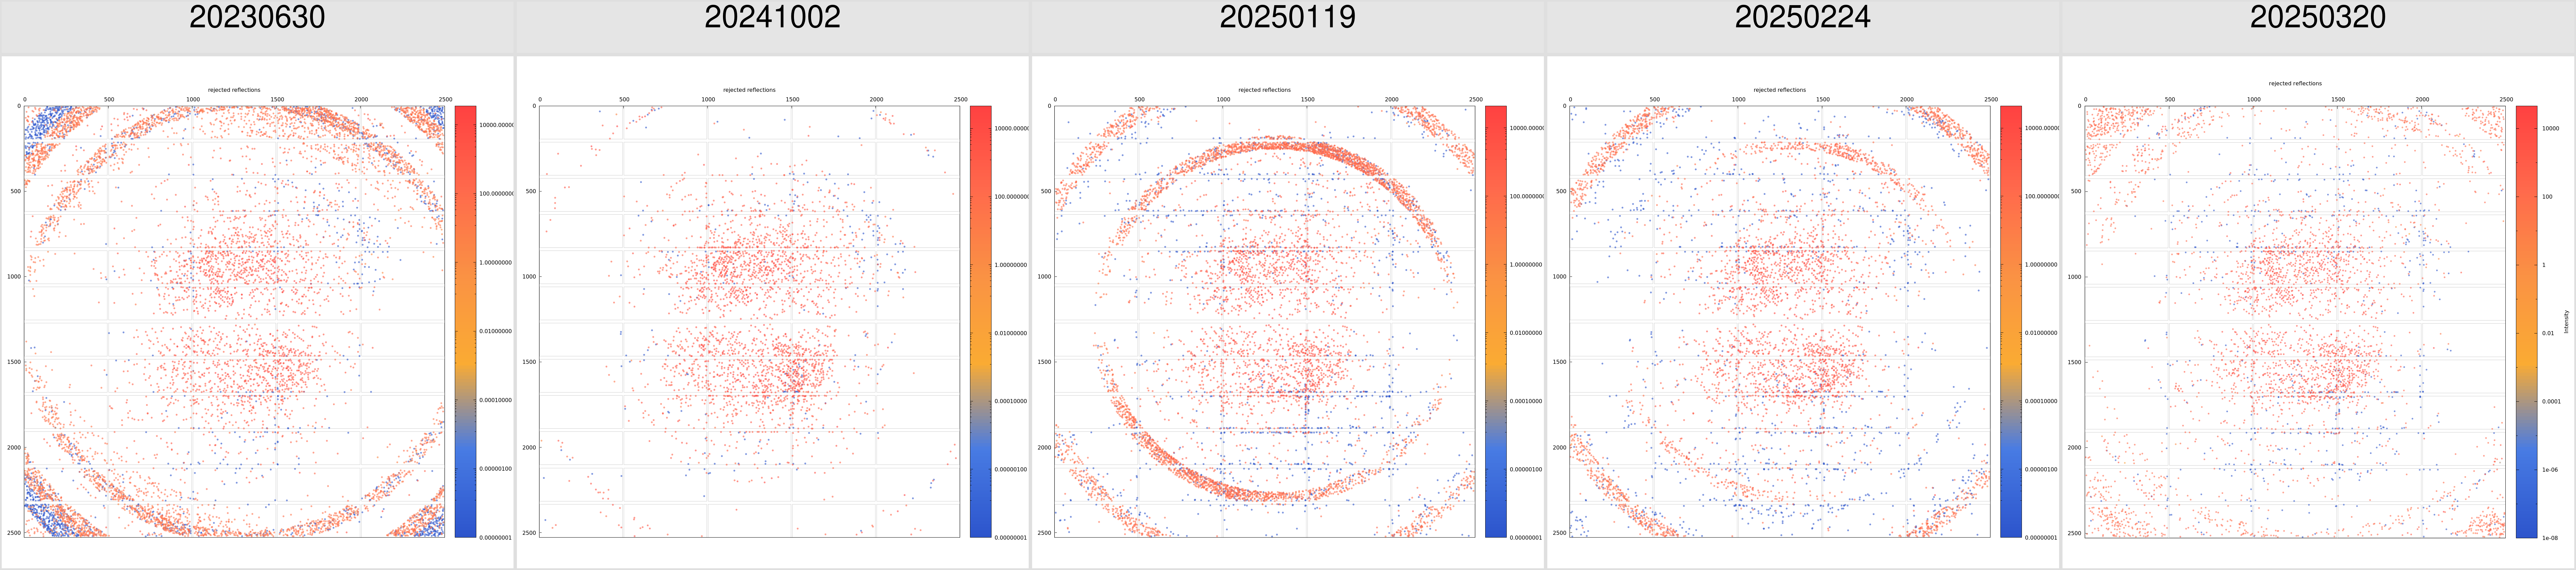 |
| 6NQY | 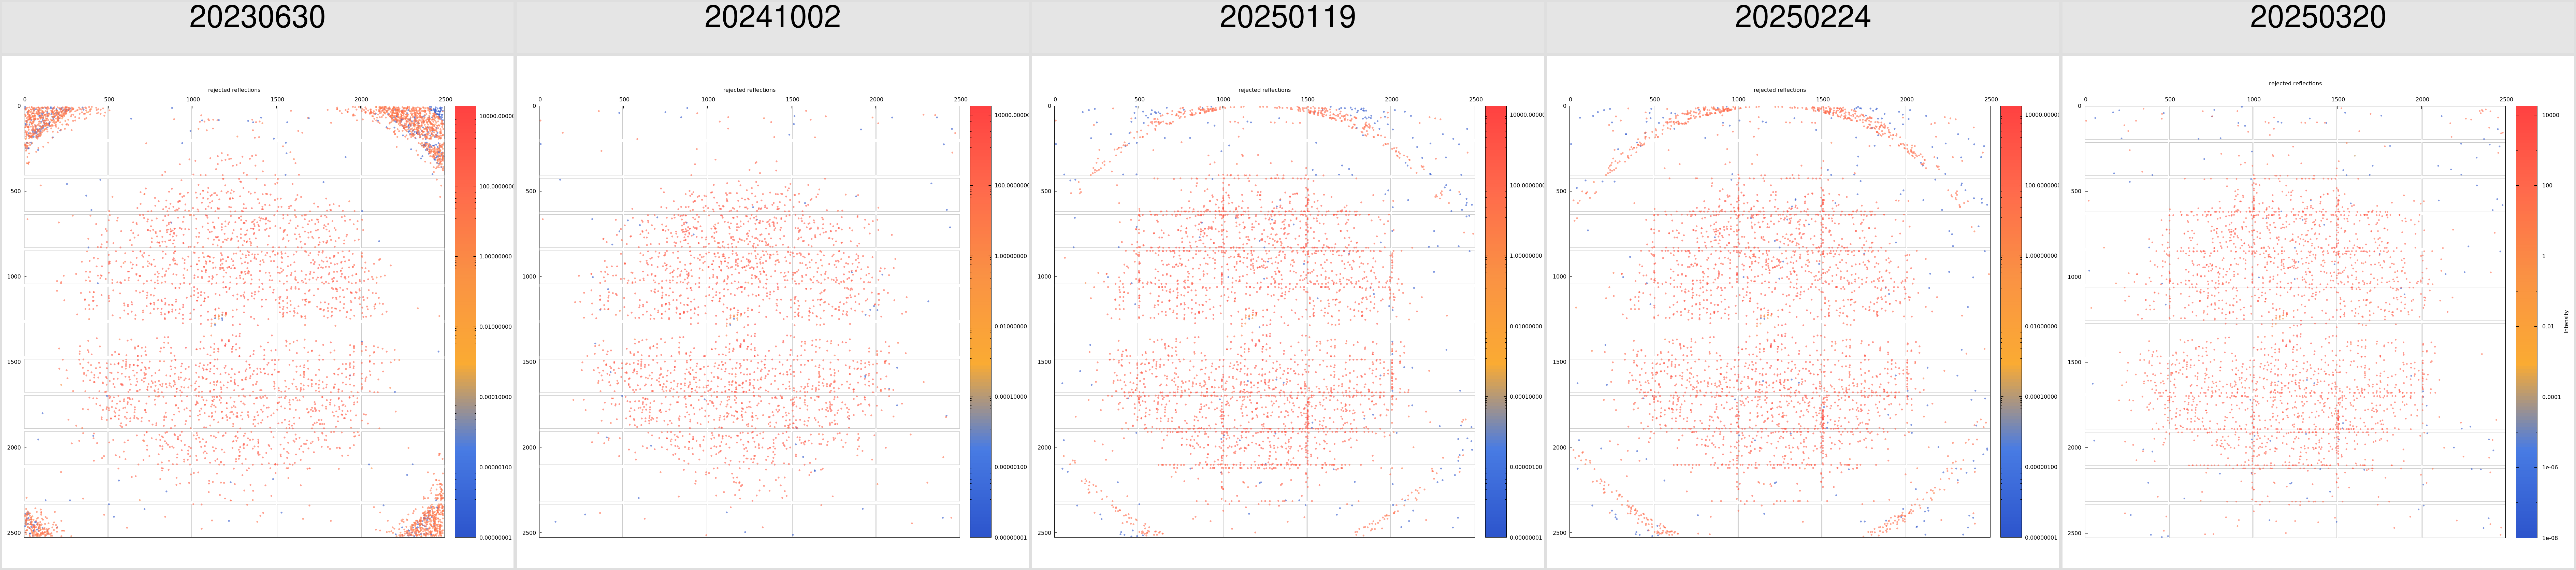 |
| 6P8P | 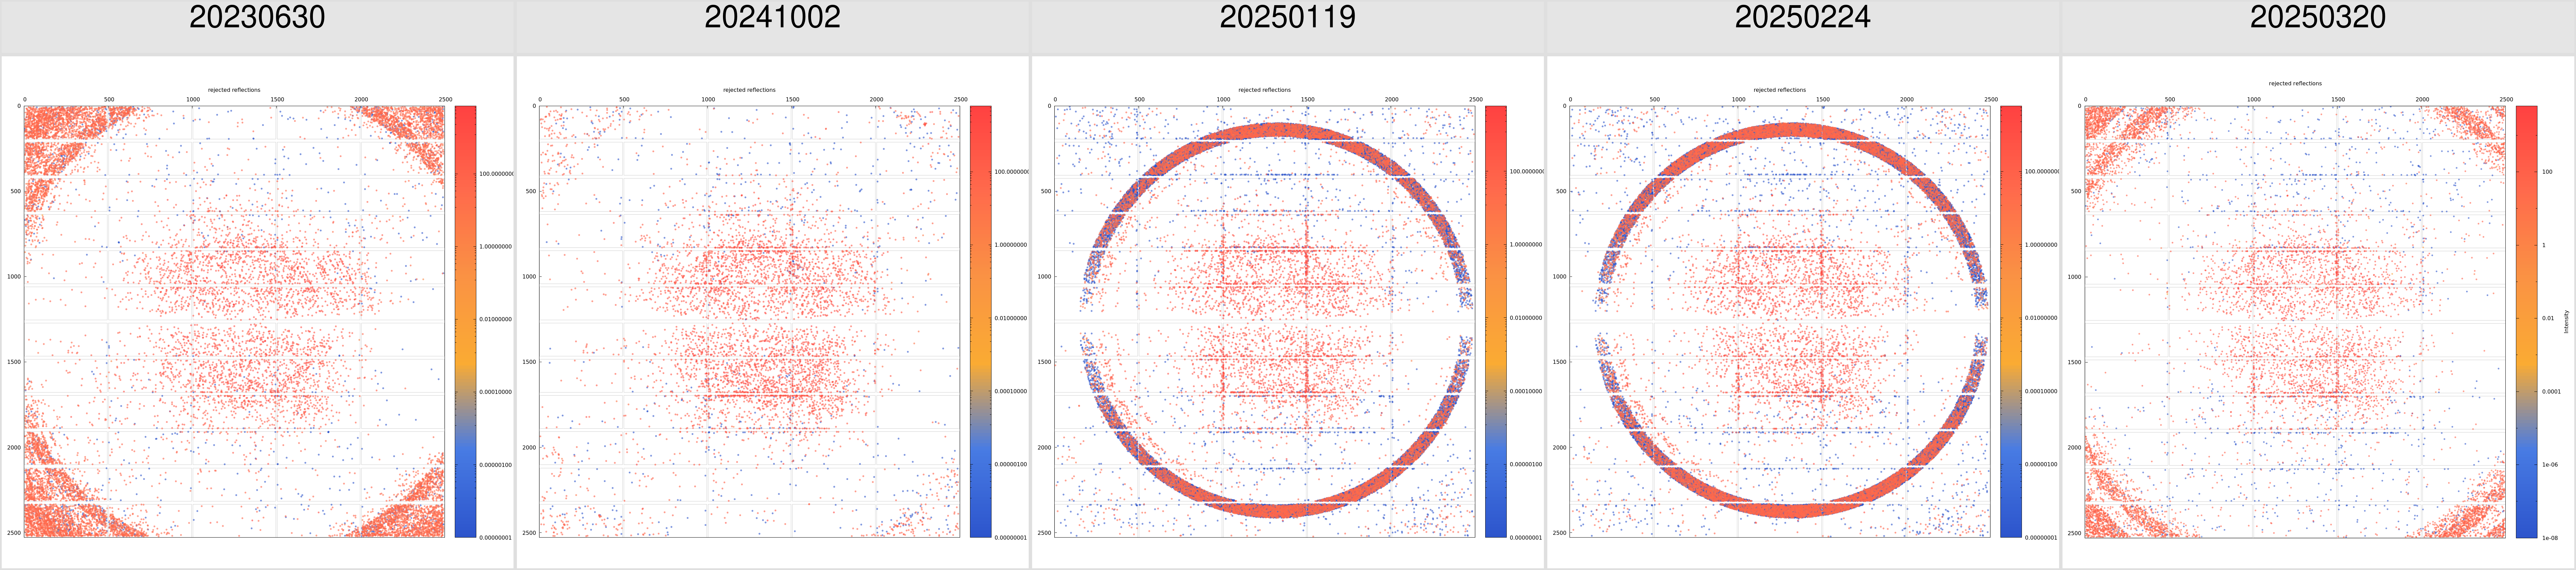 |
| 6P8U | 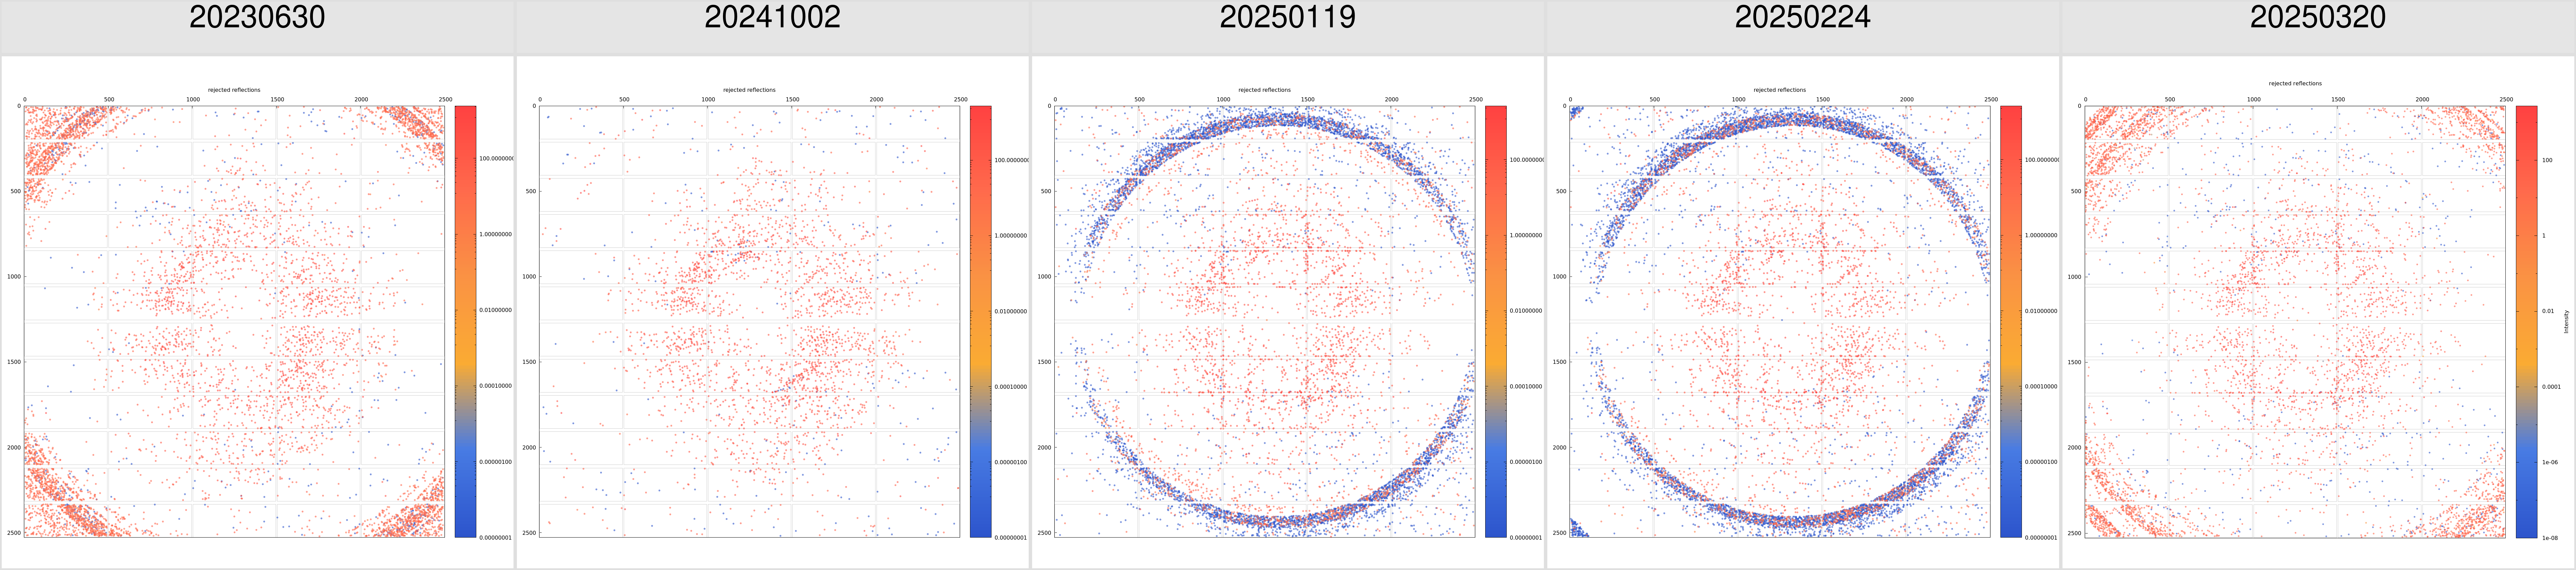 |
| 6R16 | 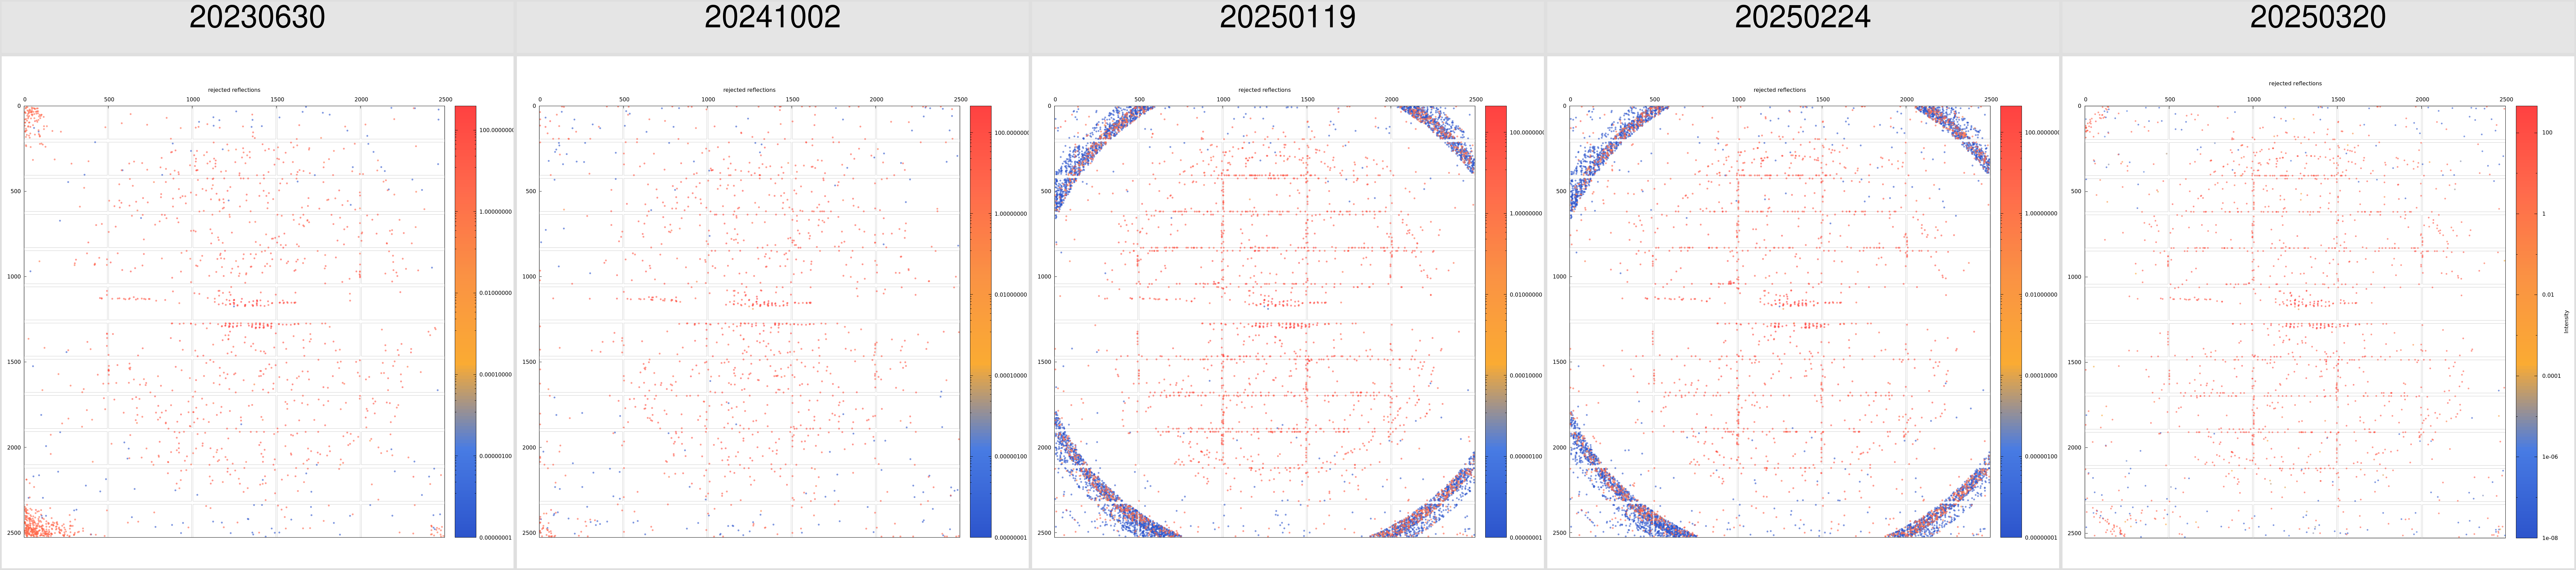 |
| 6TPI |  |
| 6UCA | 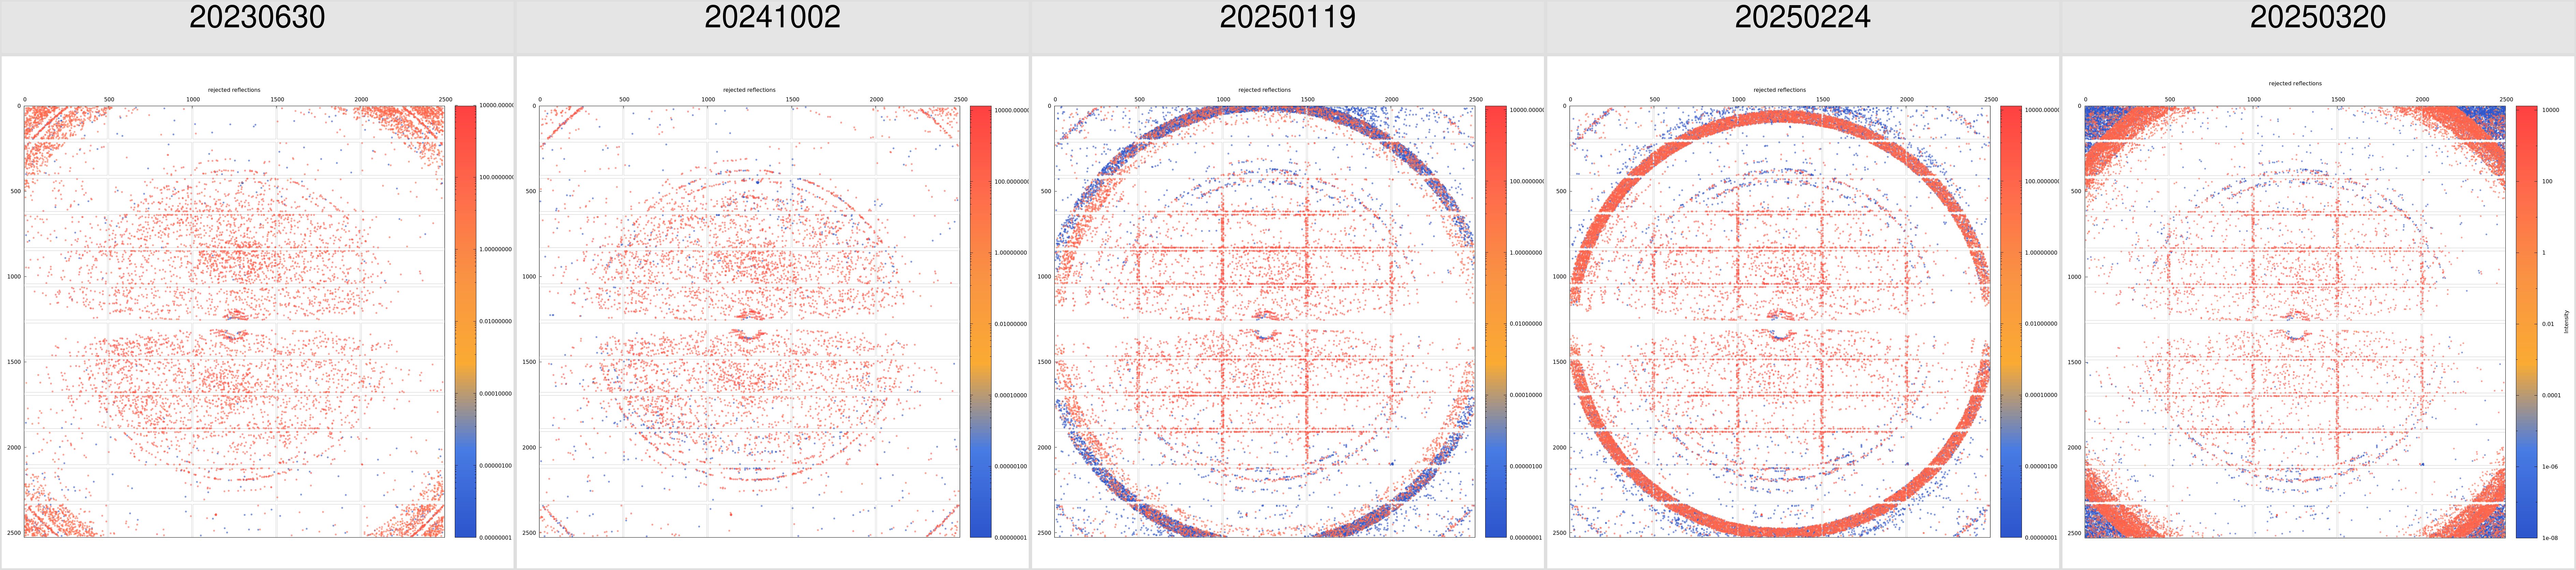 |
| 6VZQ | 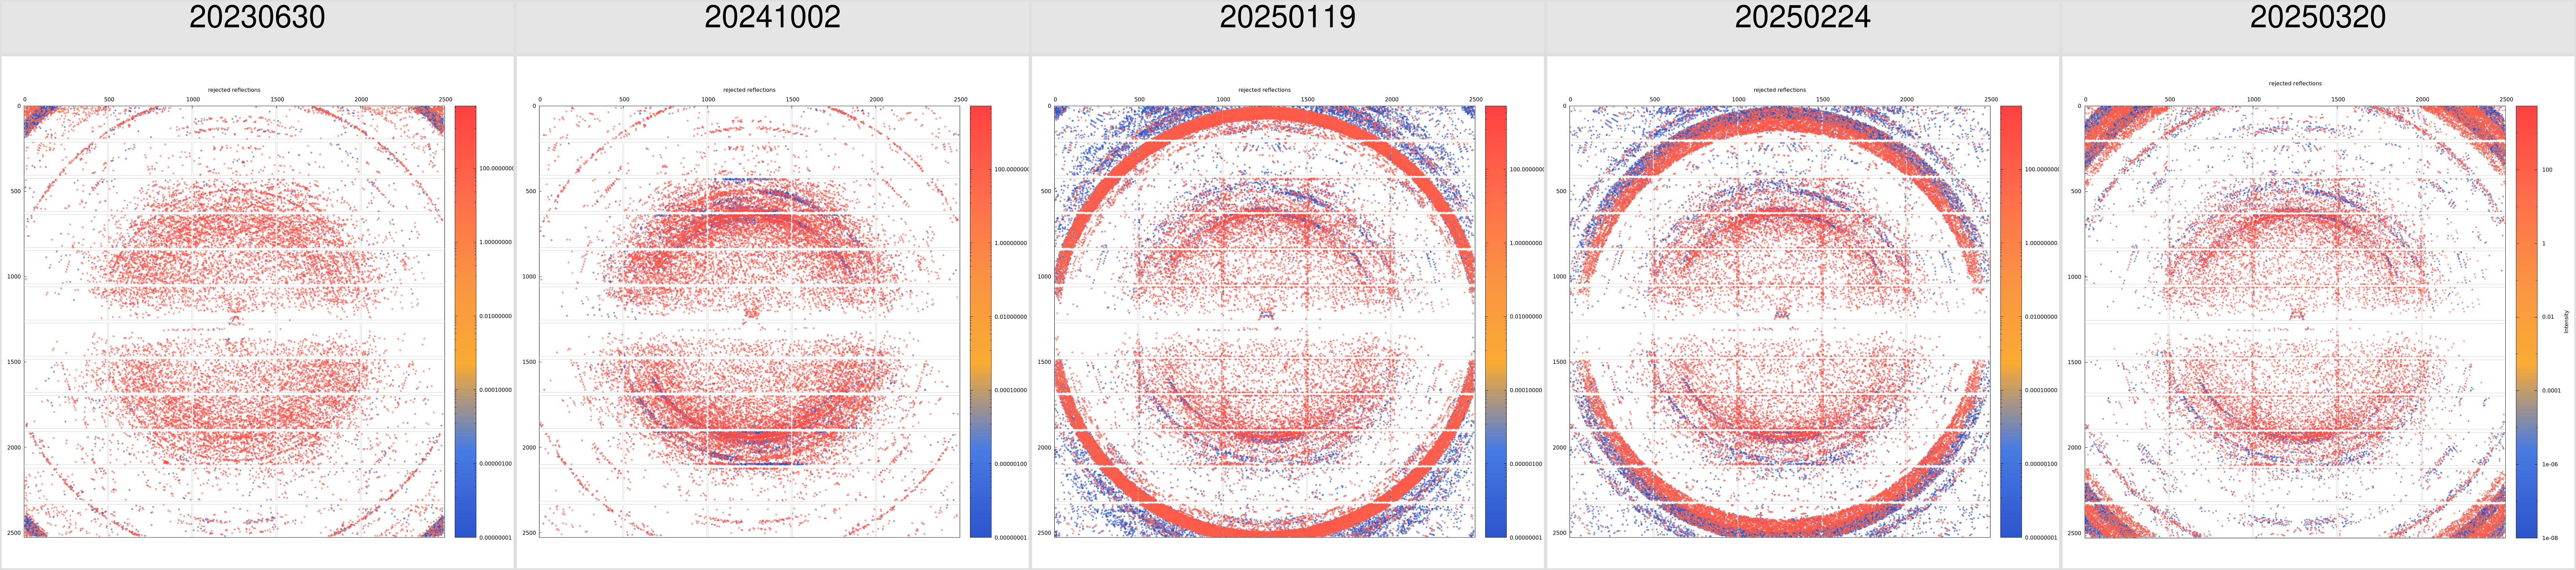 |
| 6VZW | 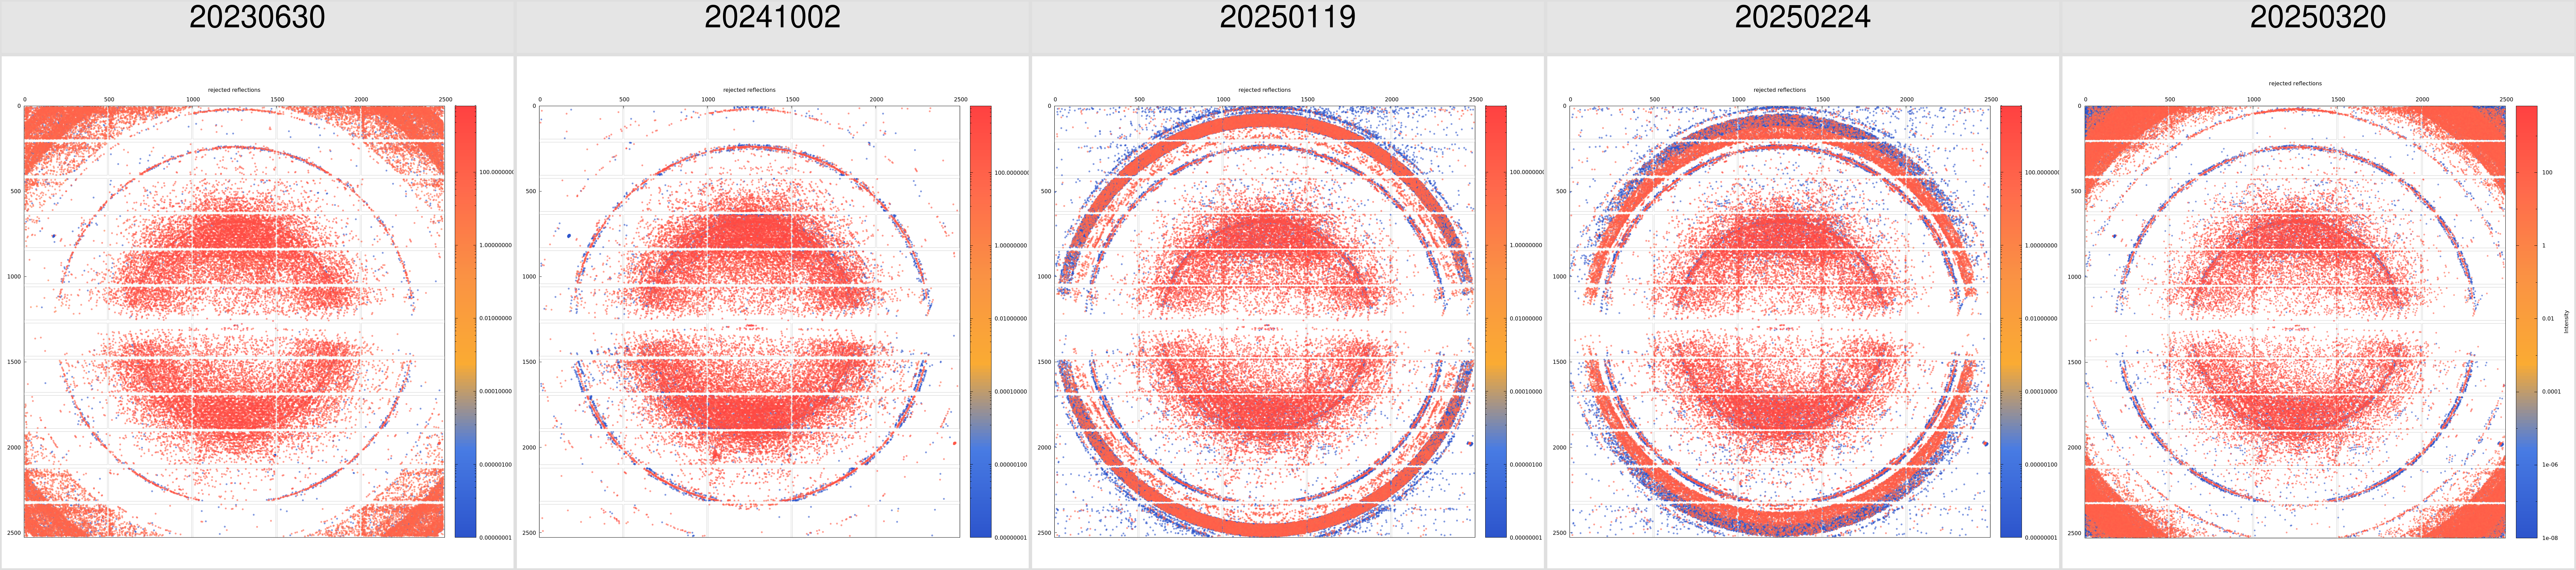 |
| 7AO5 | 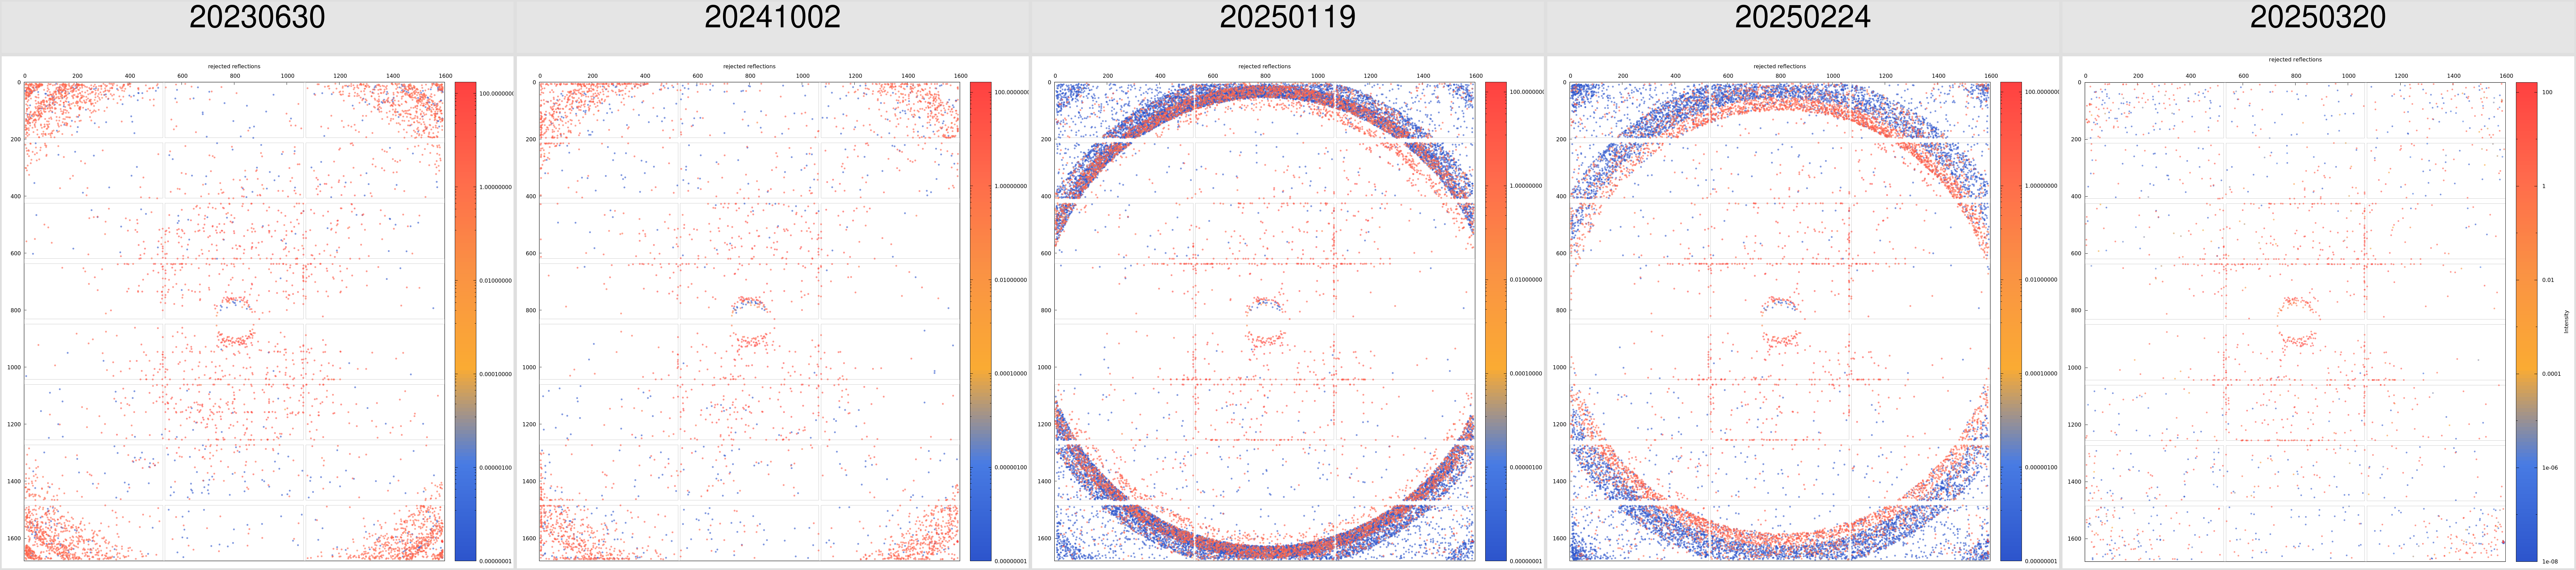 |
| 7DK1 | 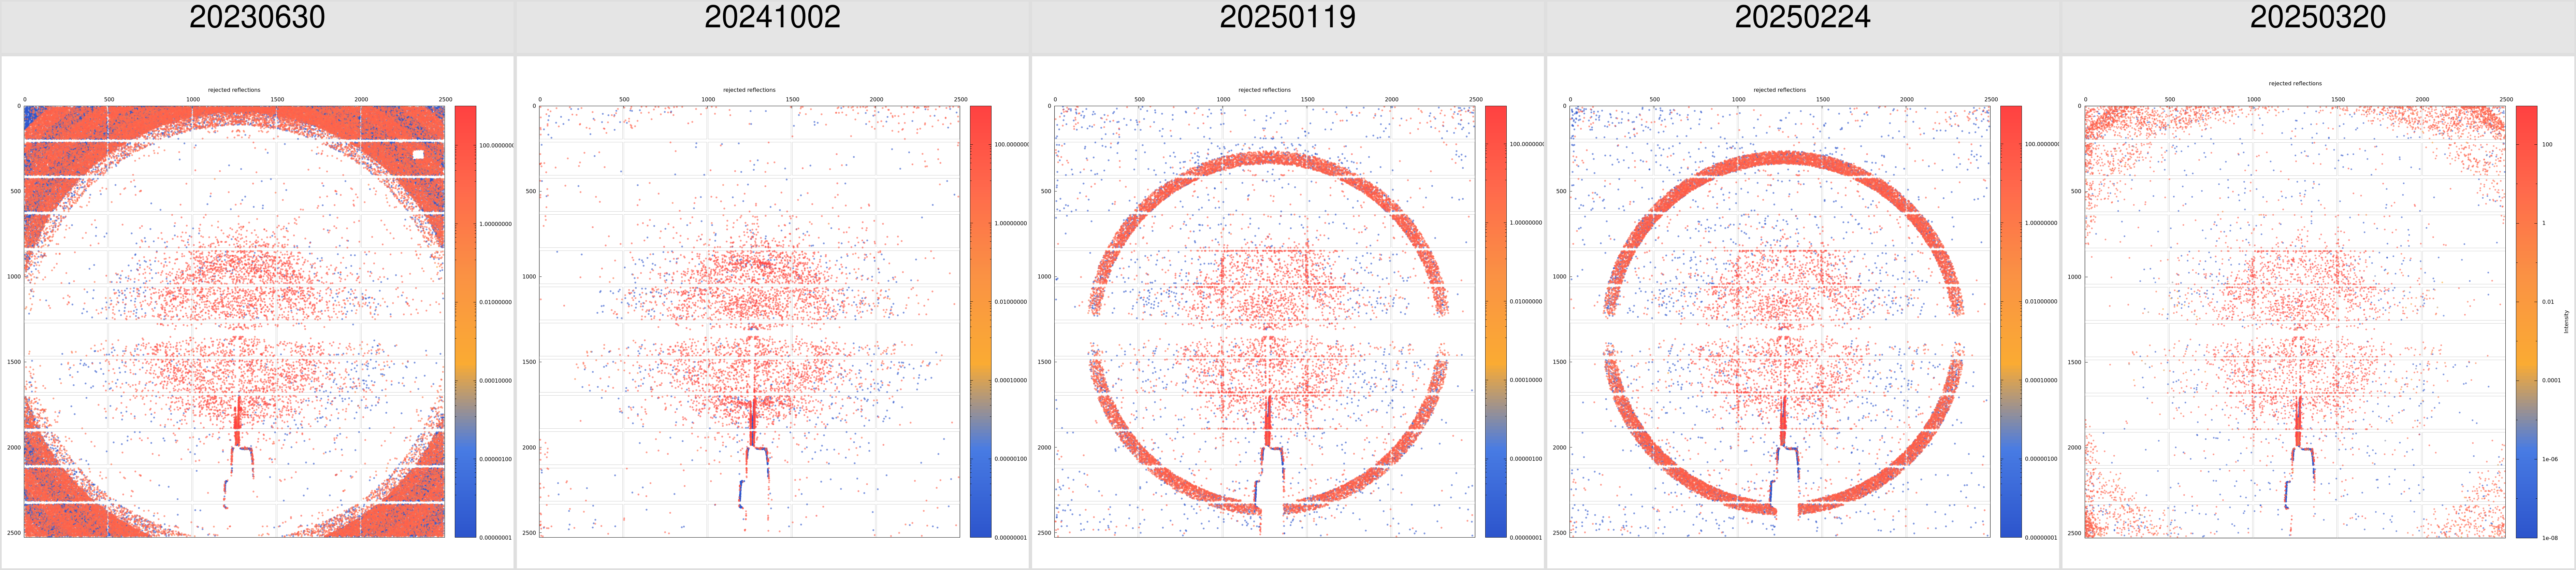 |
| 7KDS | 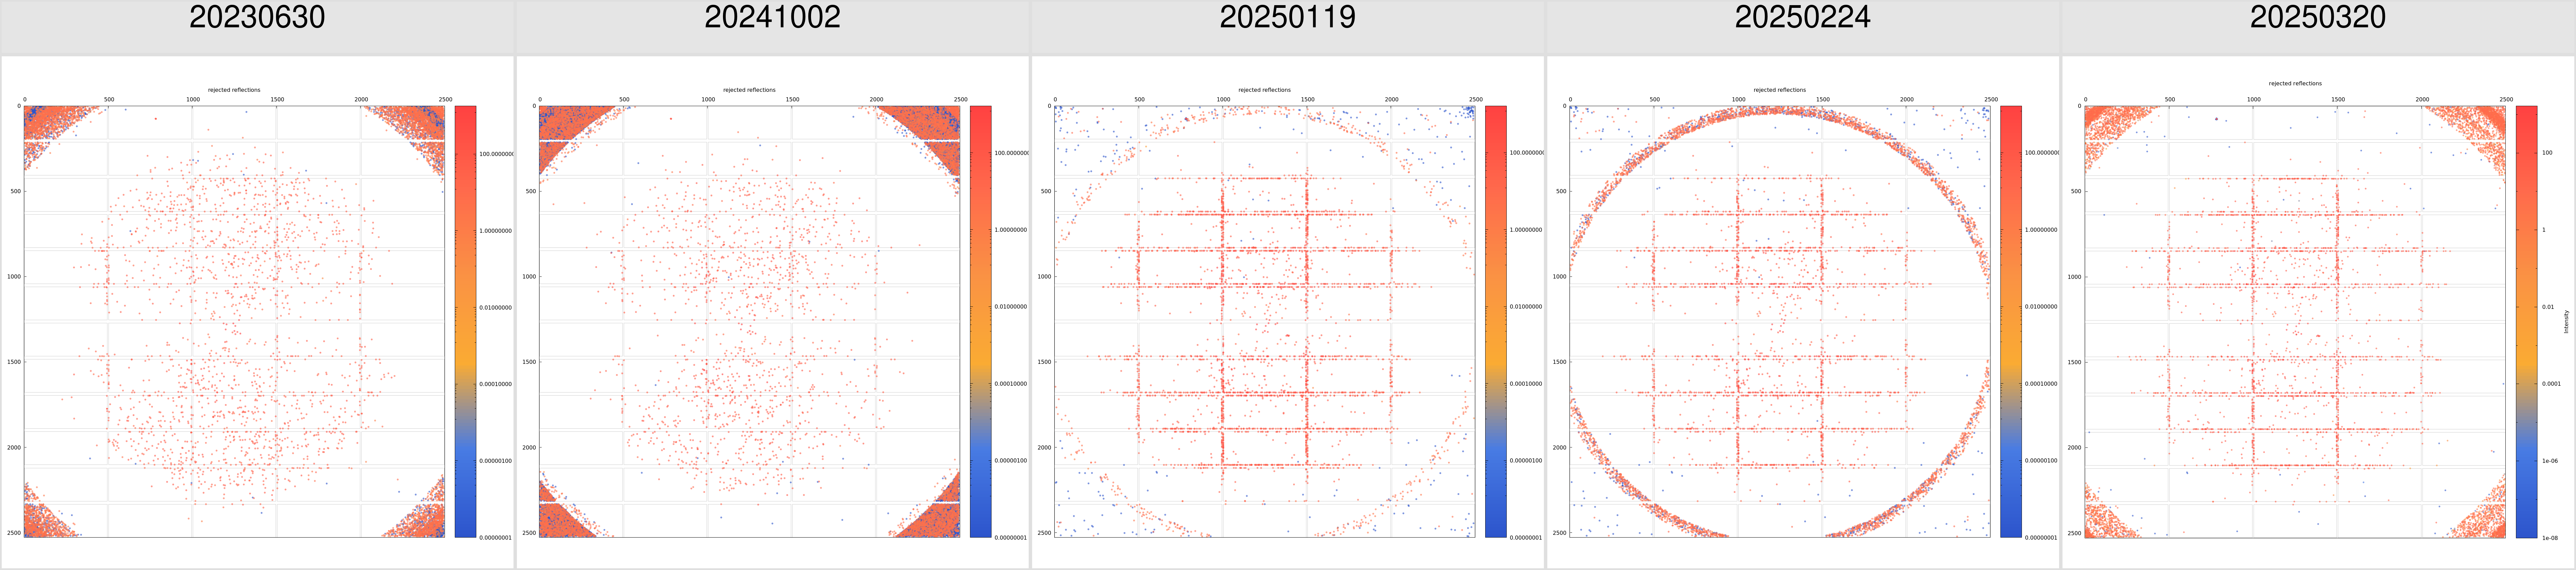 |
| 7MJB | 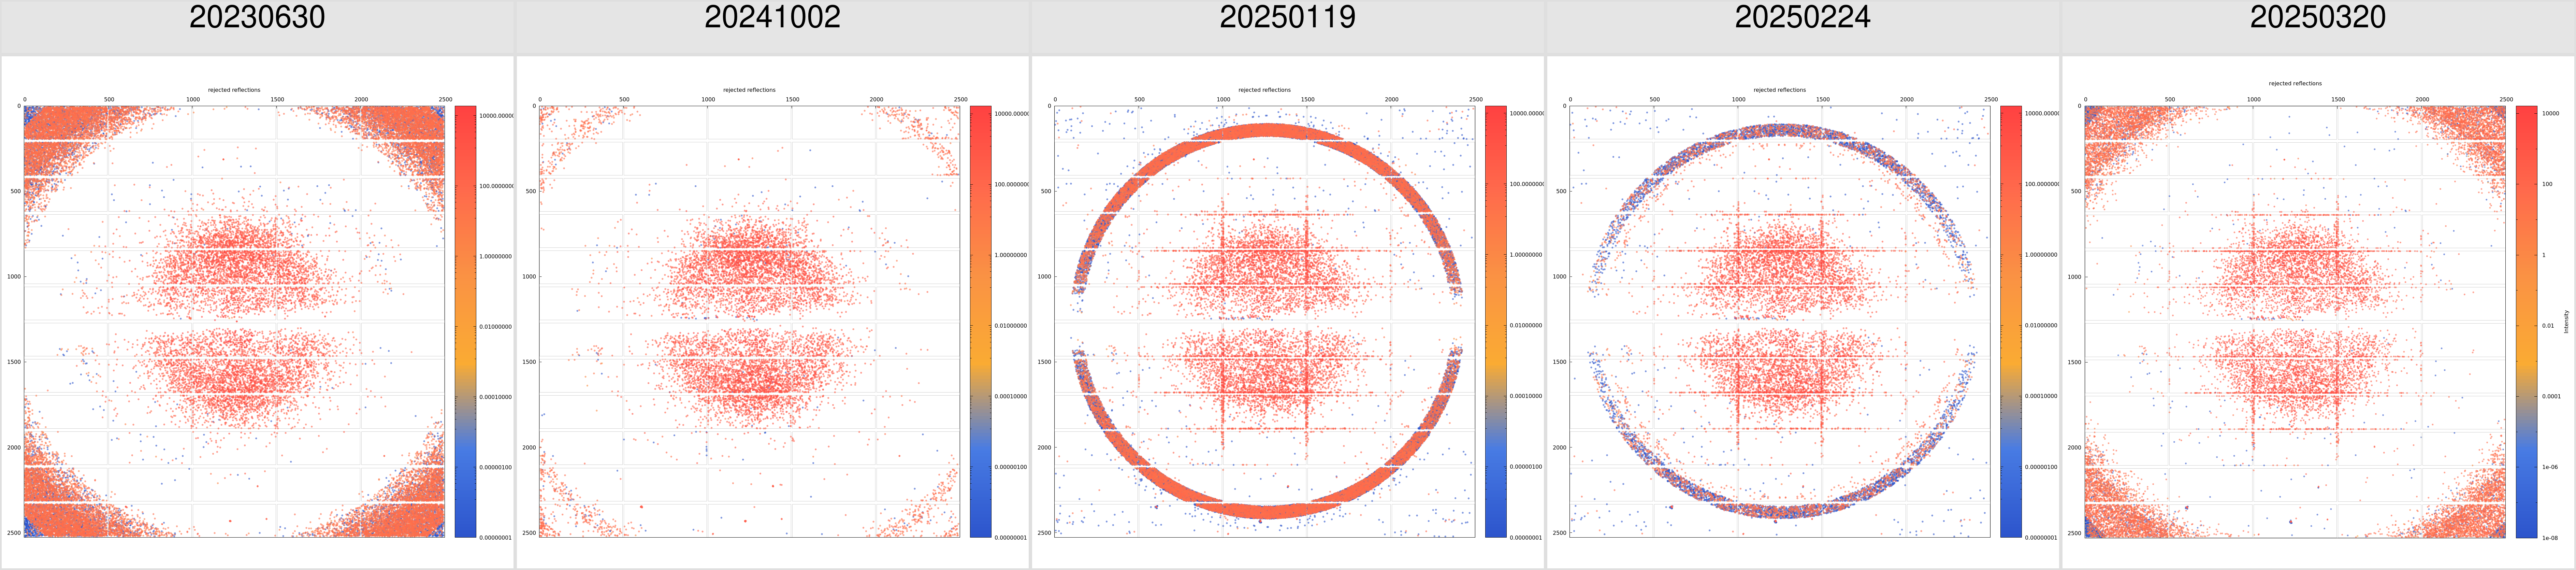 |
| 7S87 | 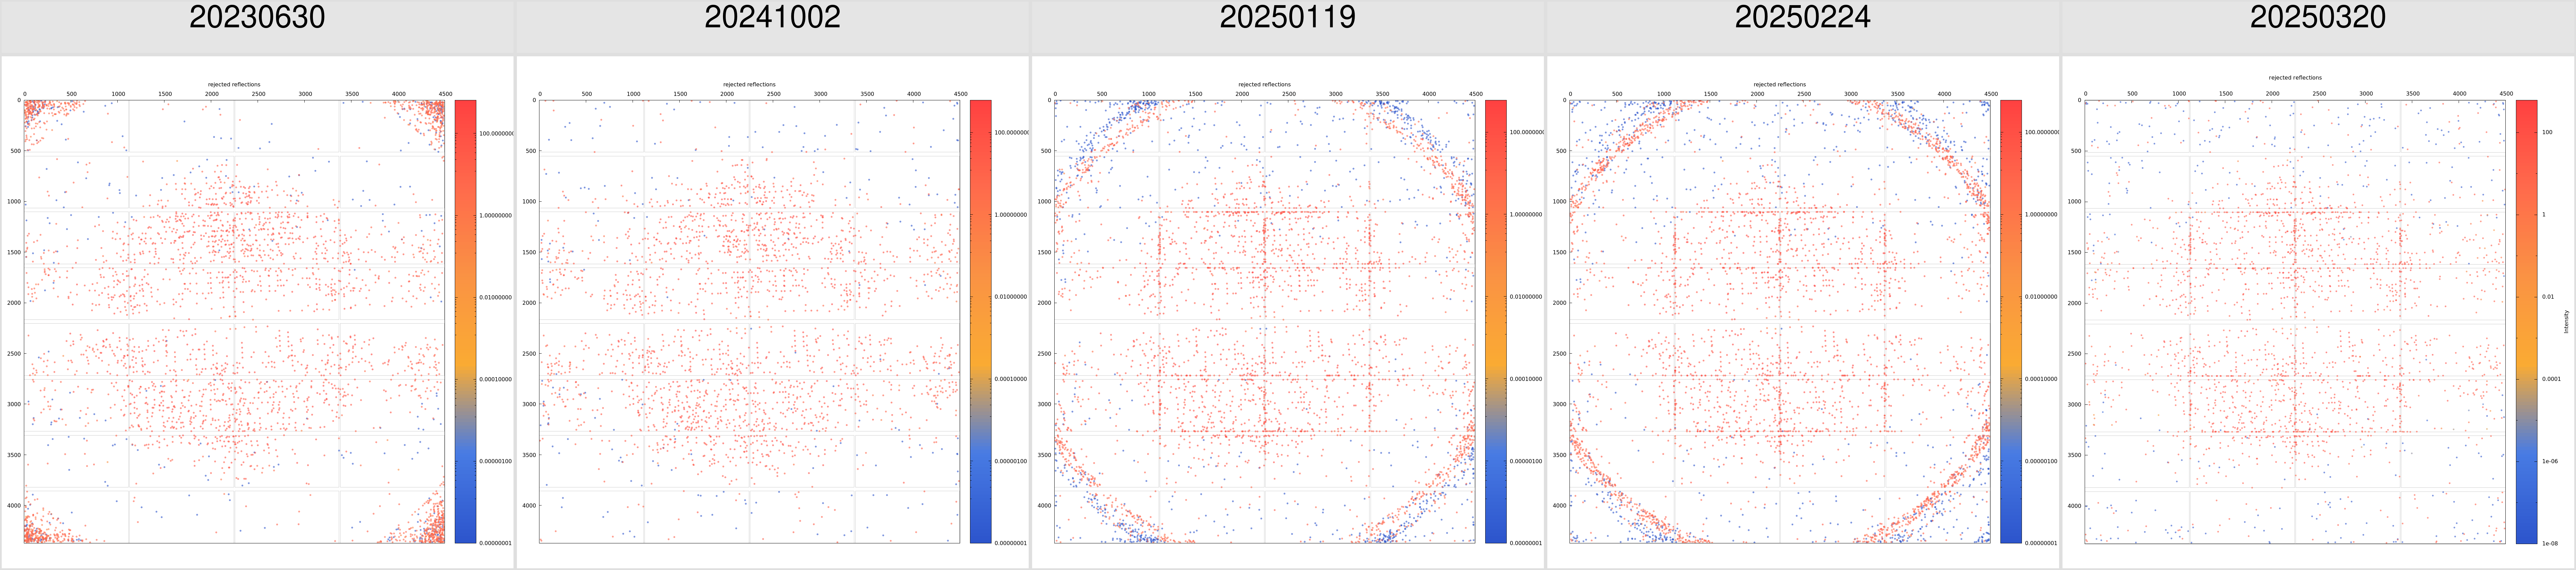 |
| 7SY9 | 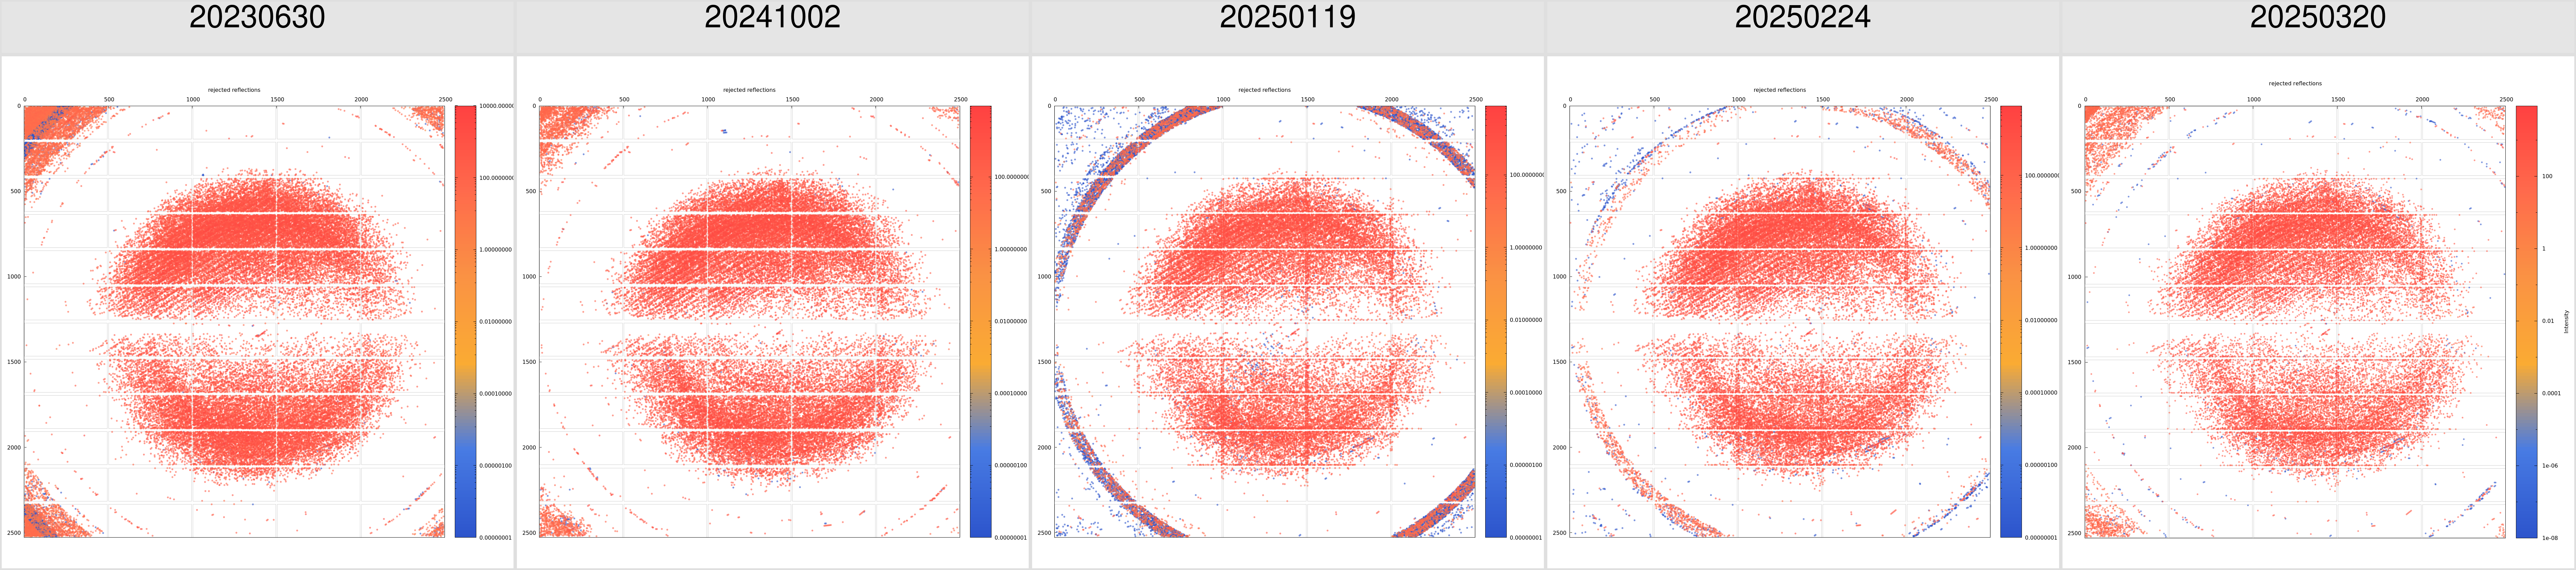 |
| 7TM9 | 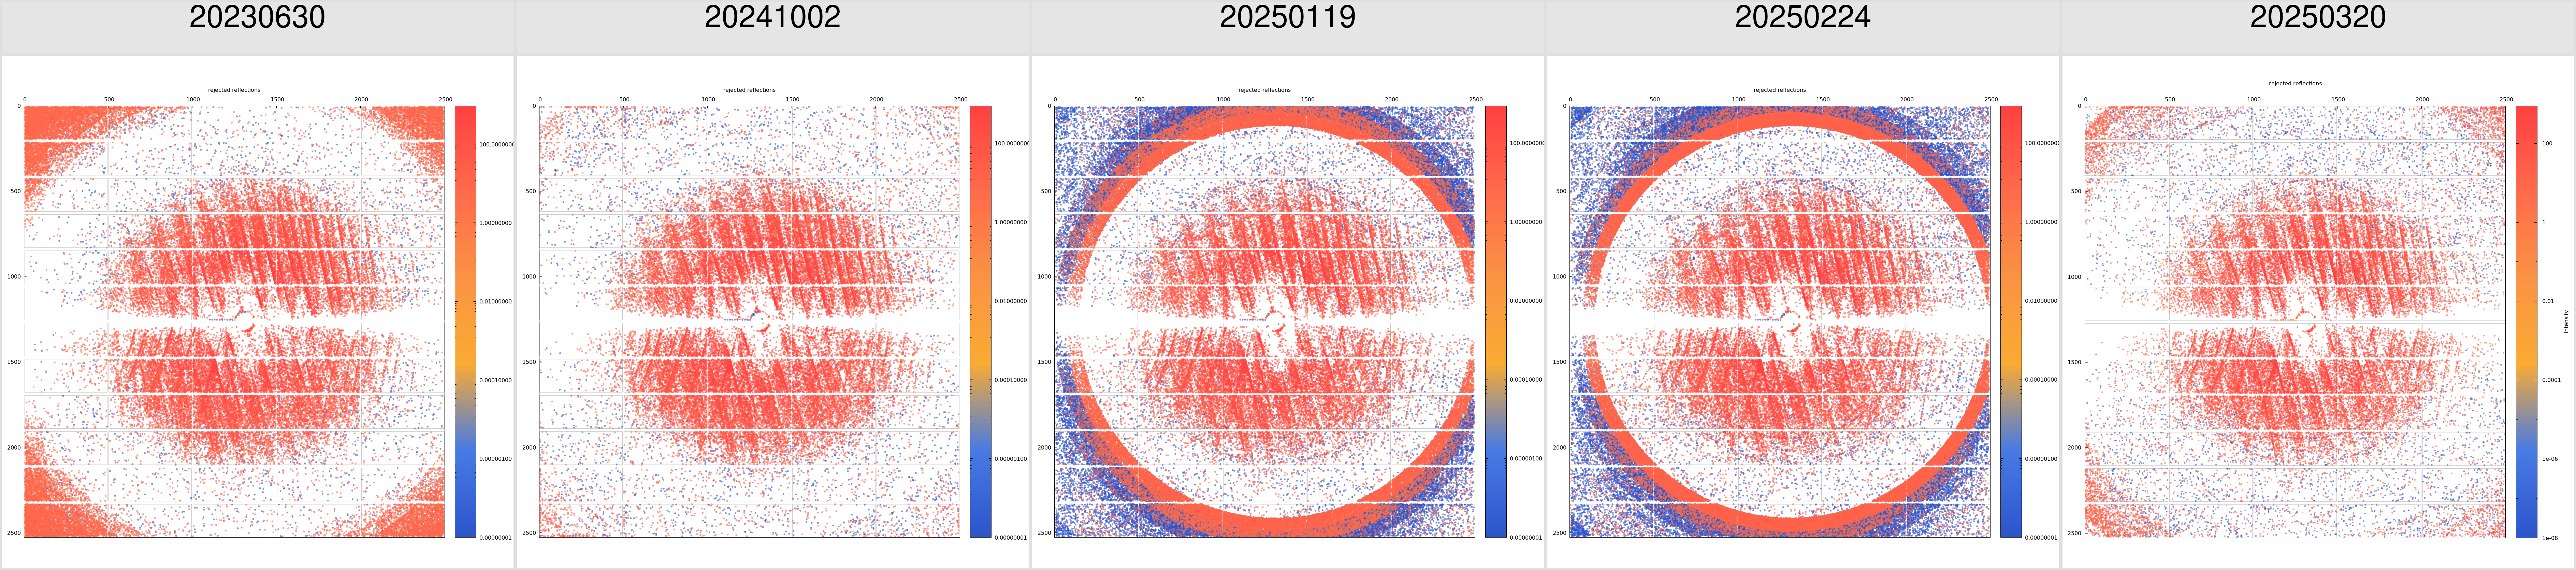 |
| 7UV5 | 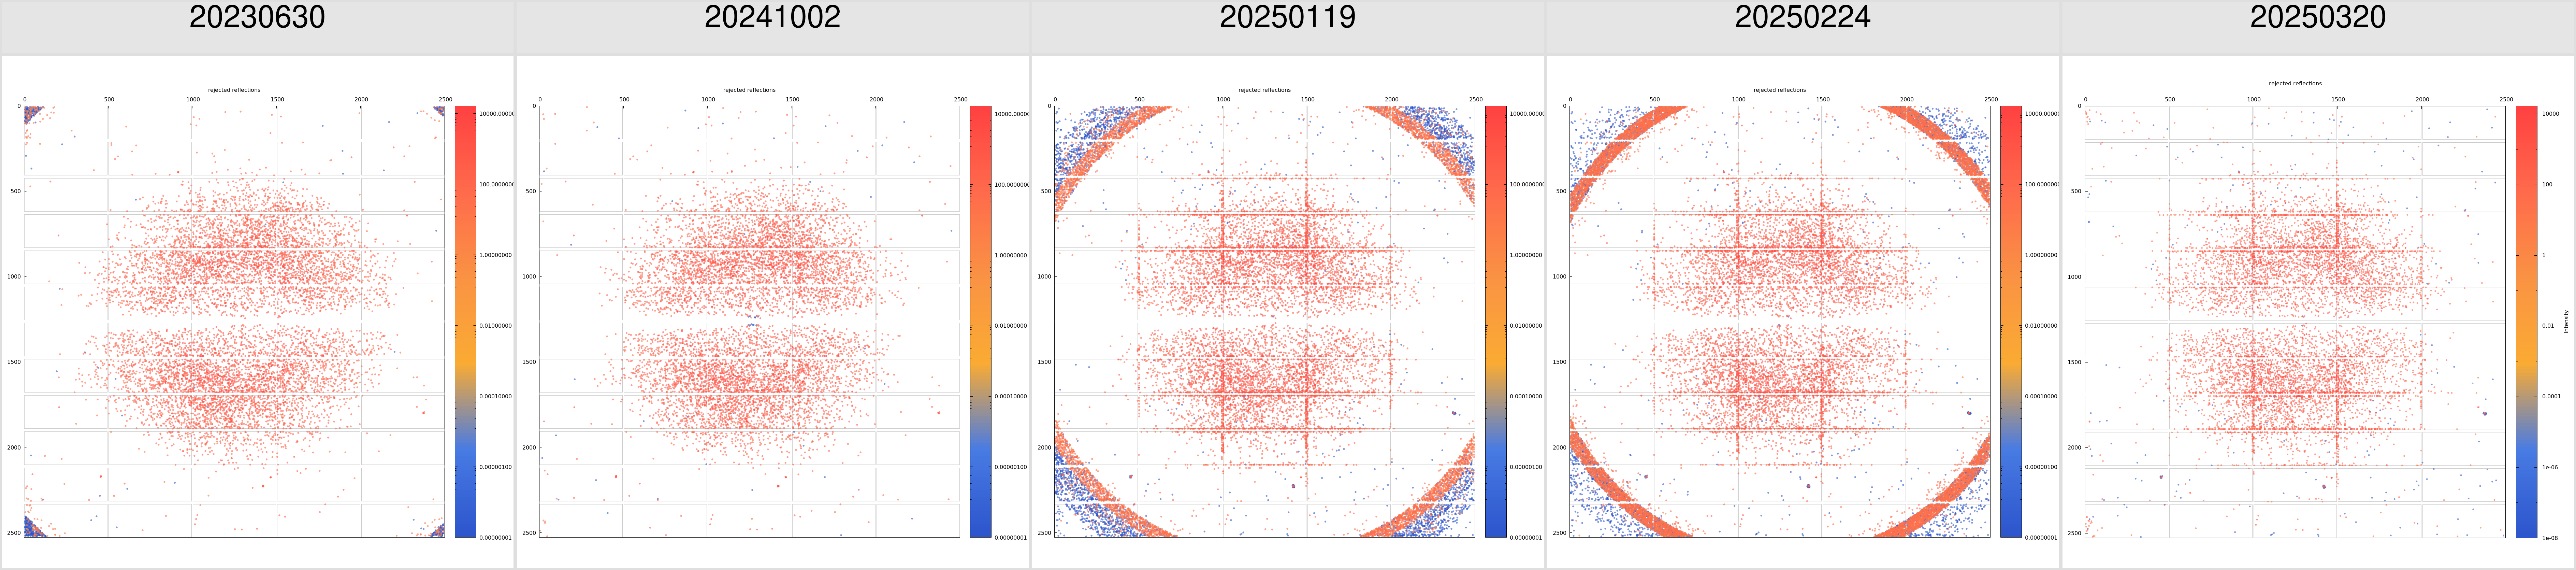 |
| 7WDA | 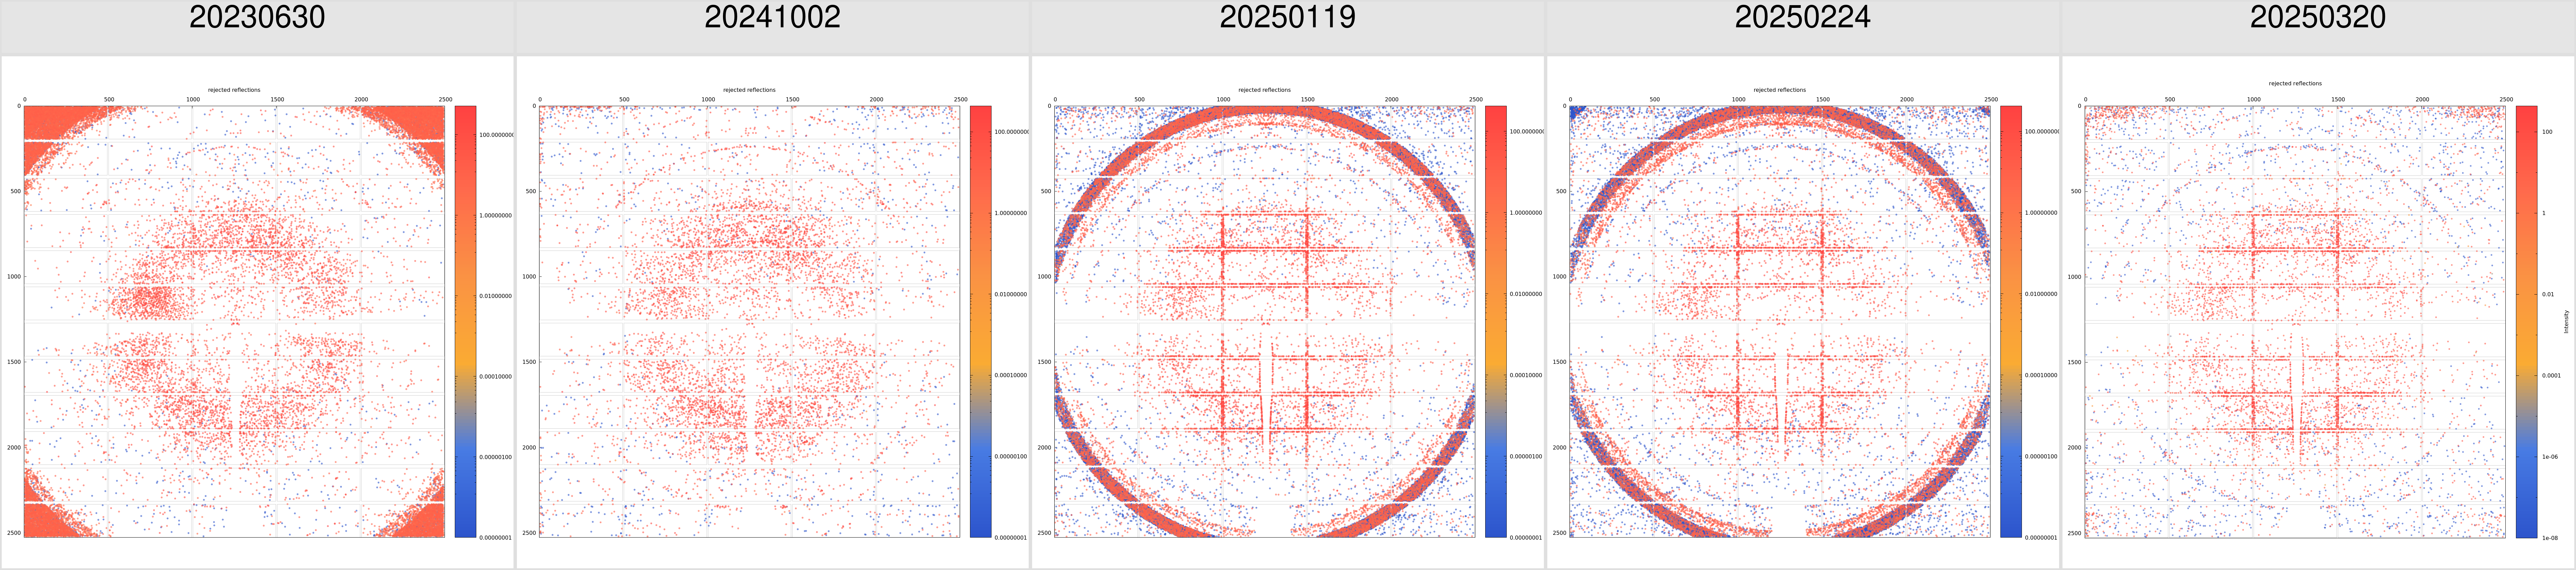 |
| 7Z1V | 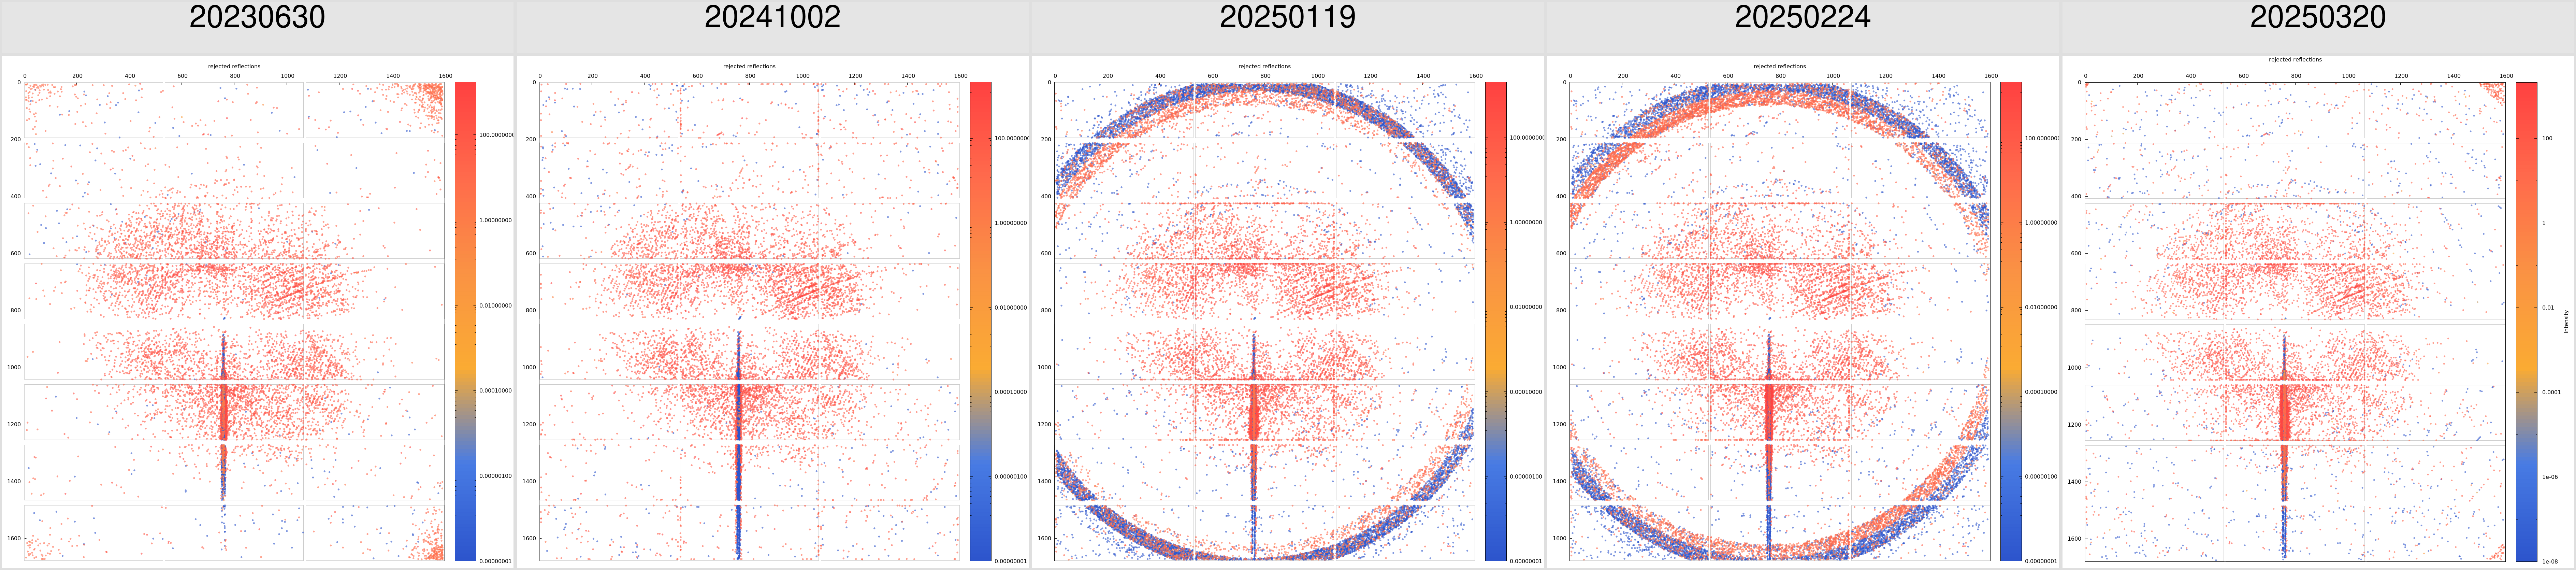 |
| 7Z1Y | 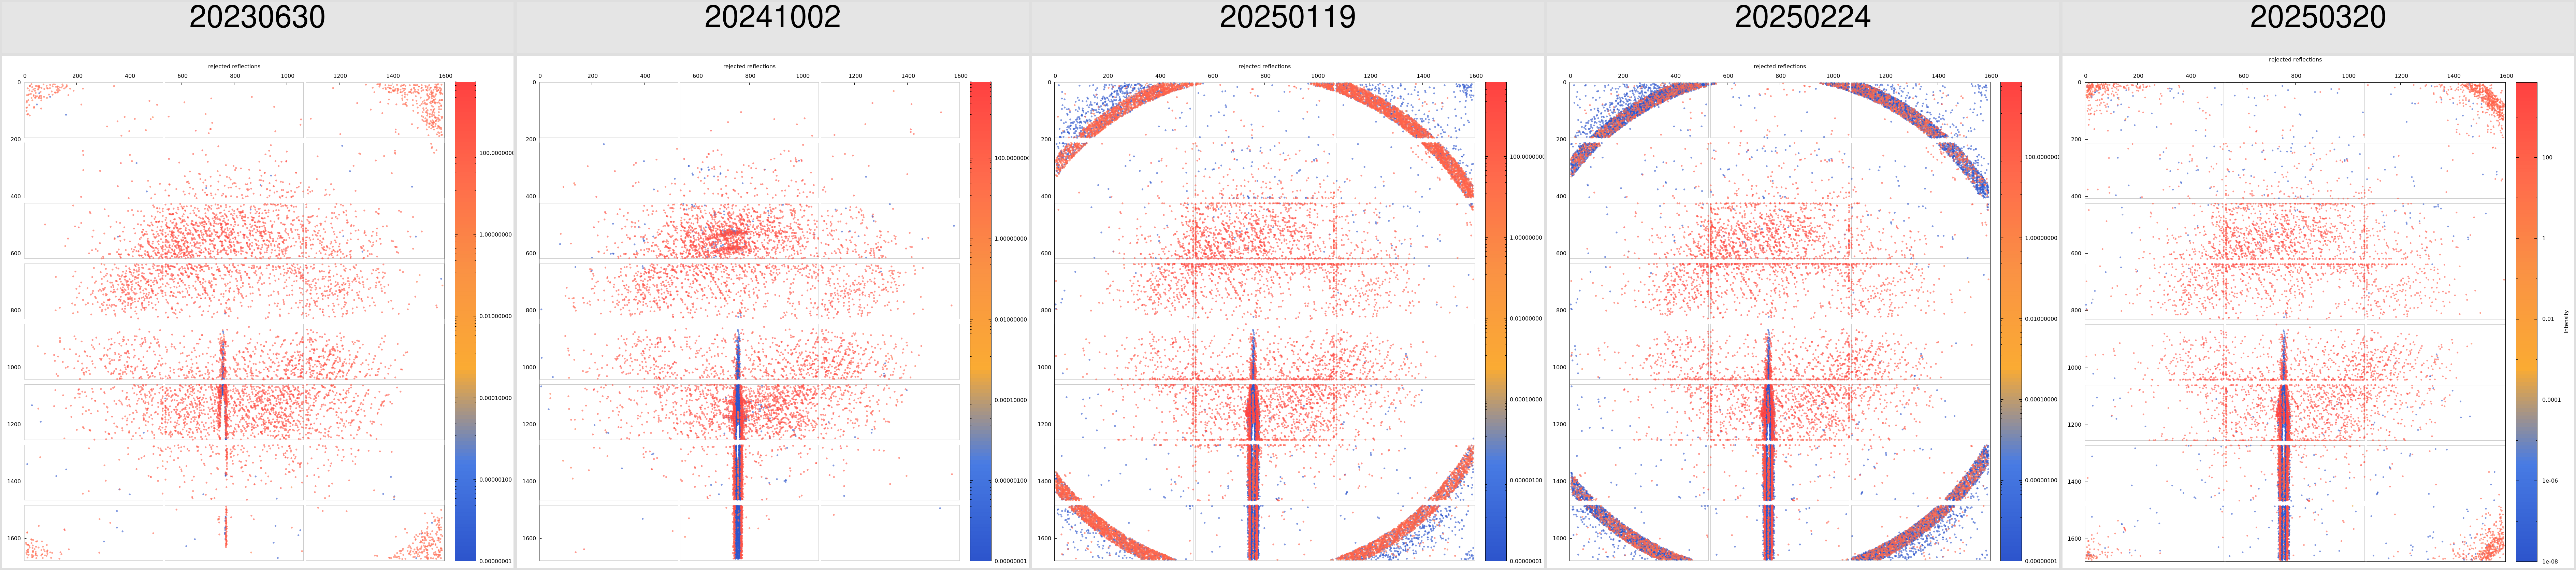 |
| 7Z41 | 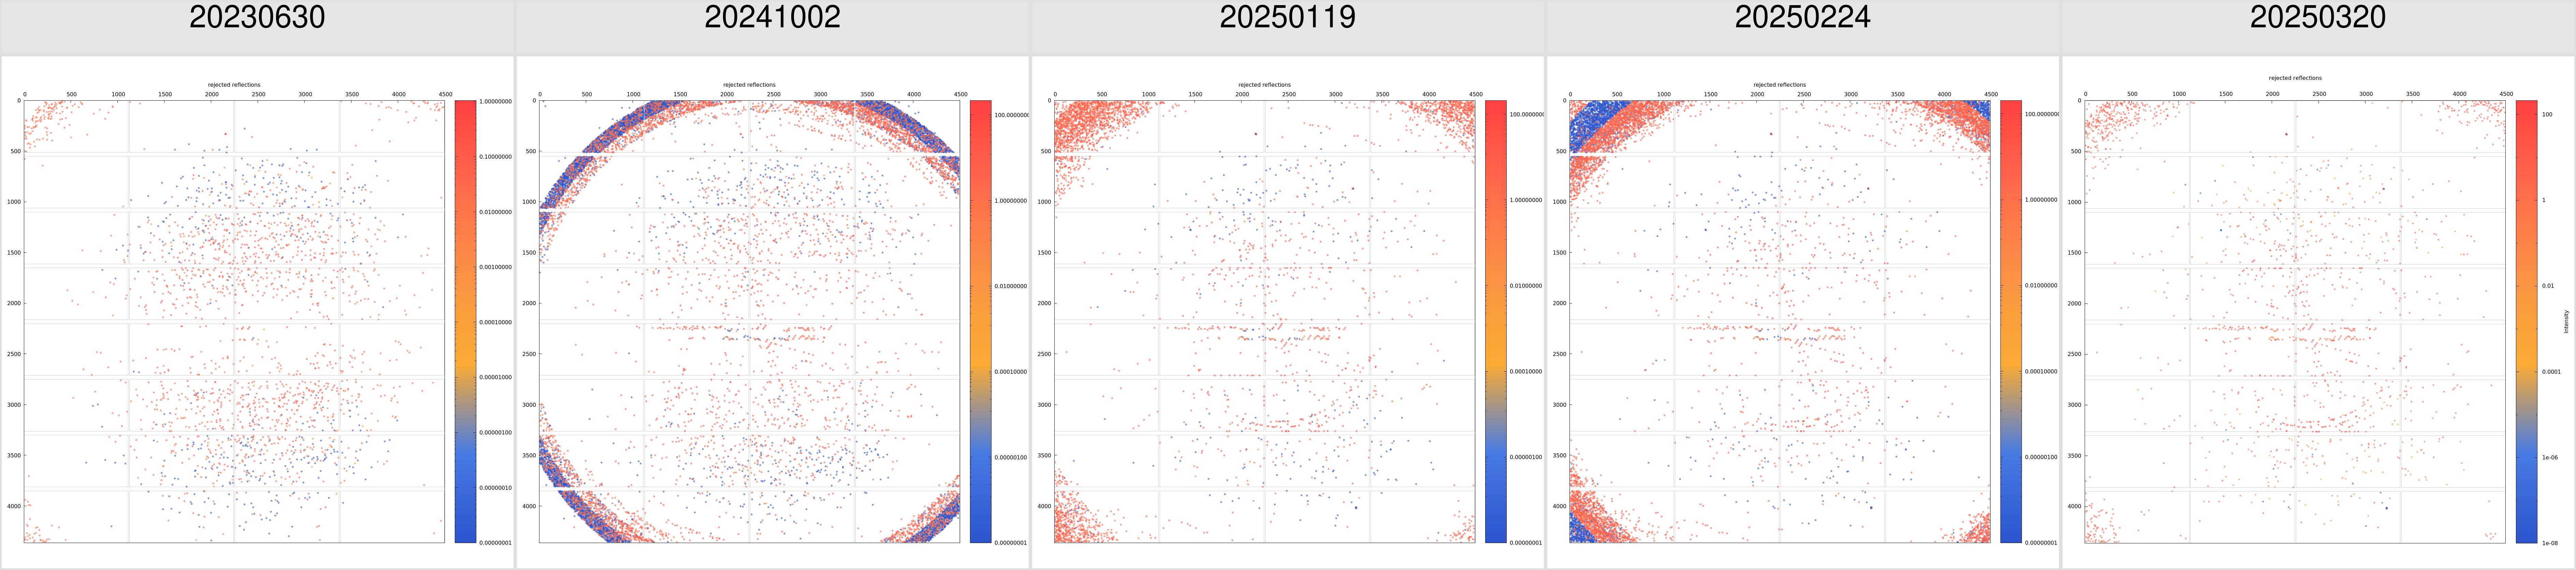 |
| 8AGQ | 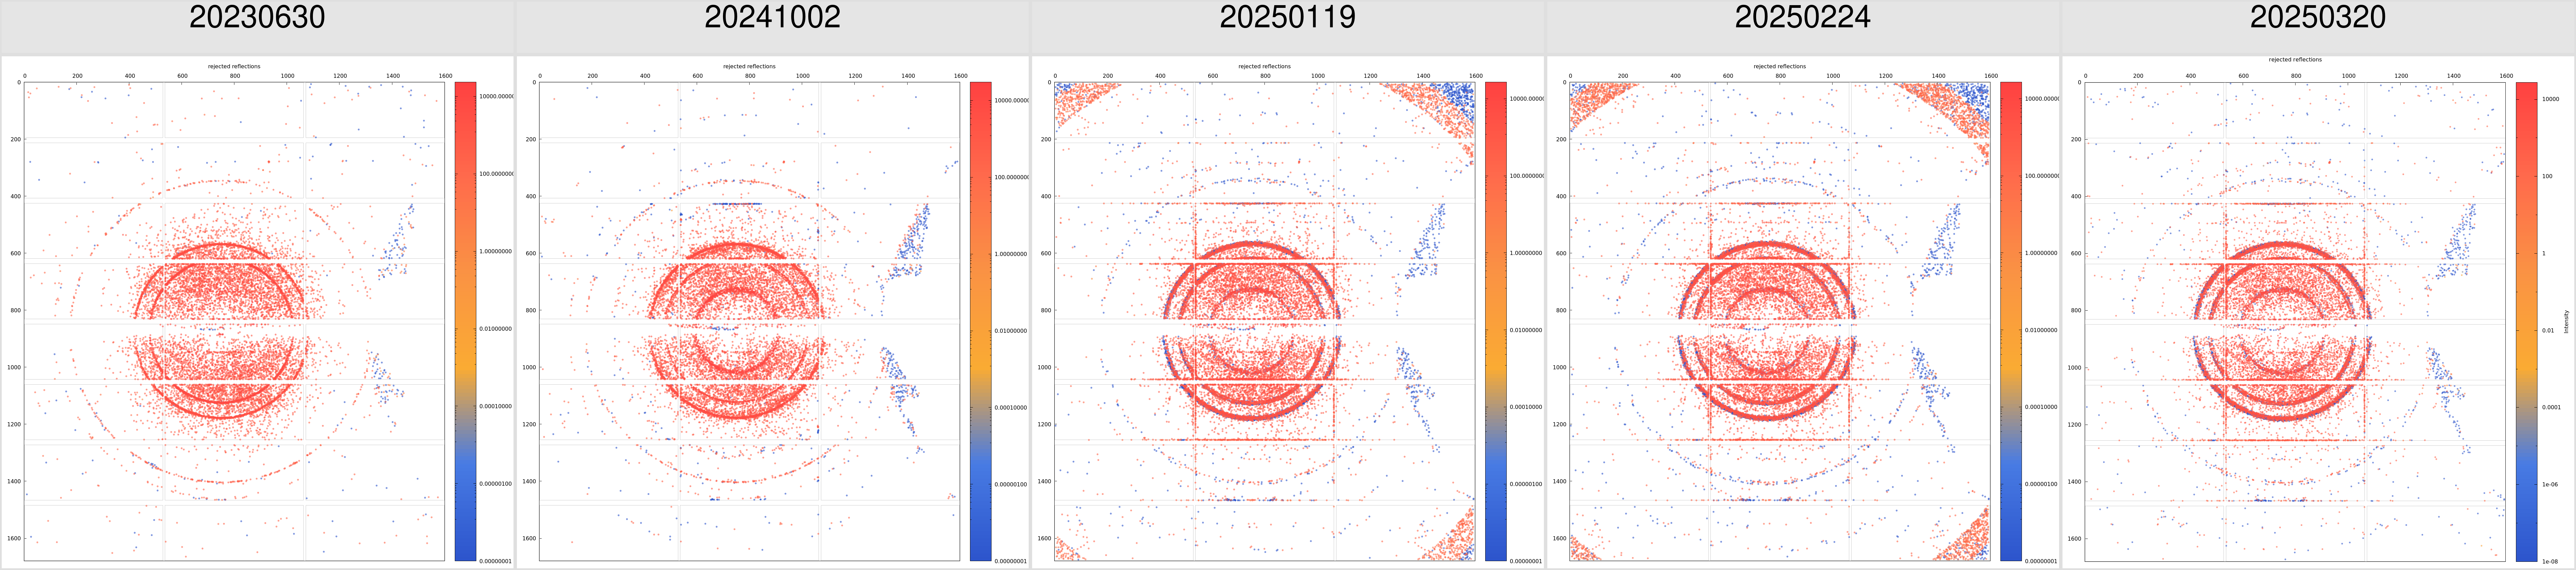 |
| 8B1N | 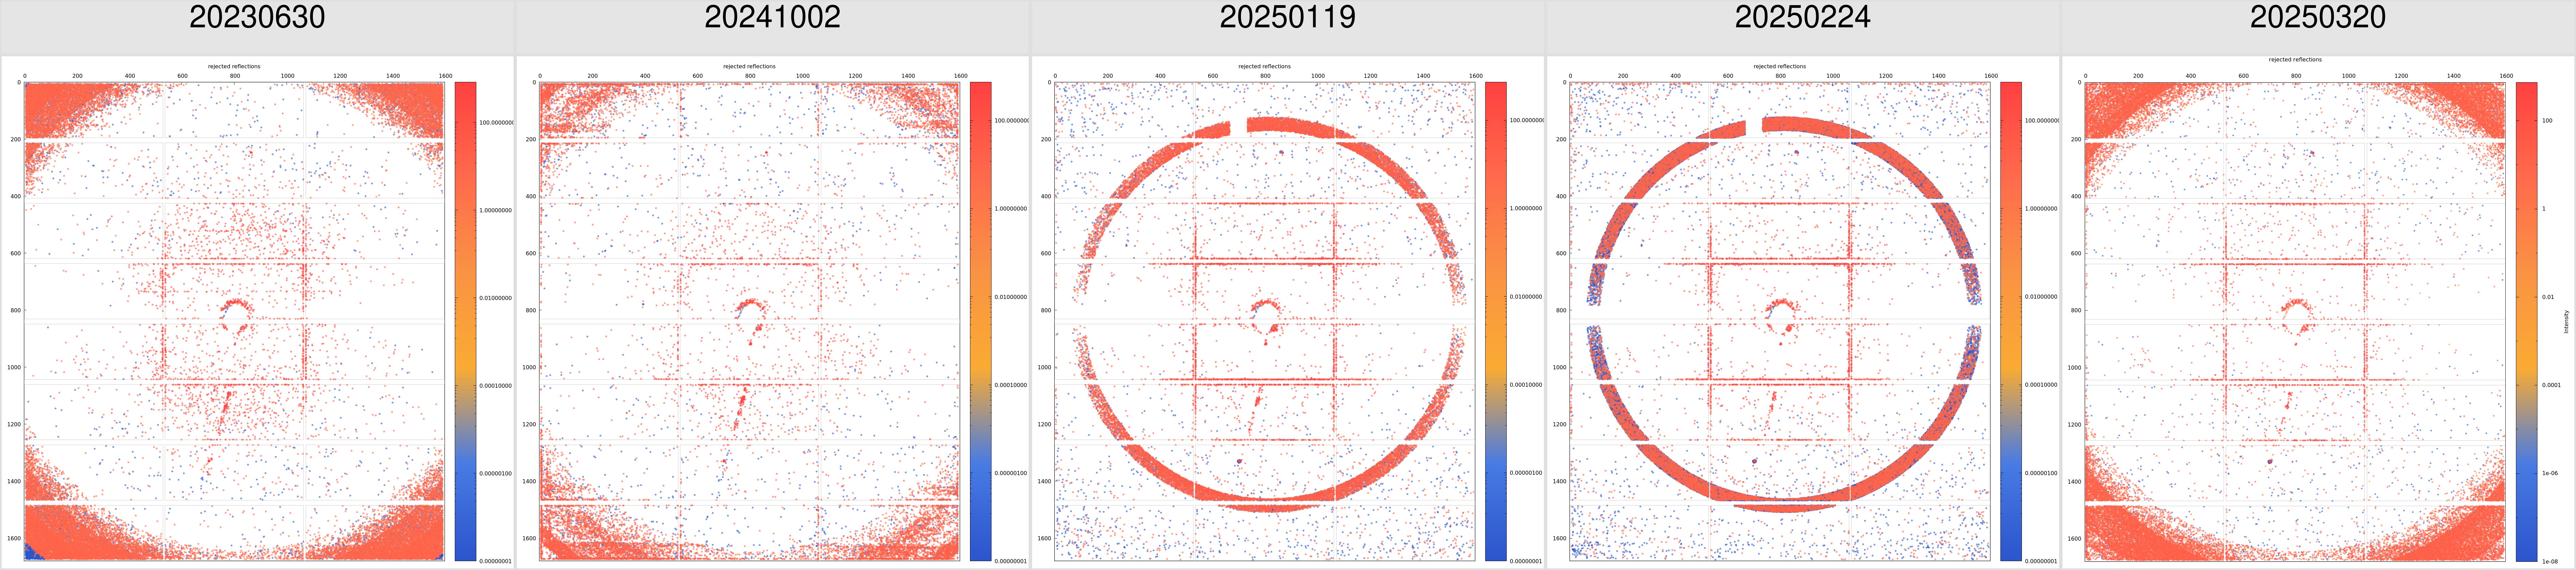 |
| 8BXT | 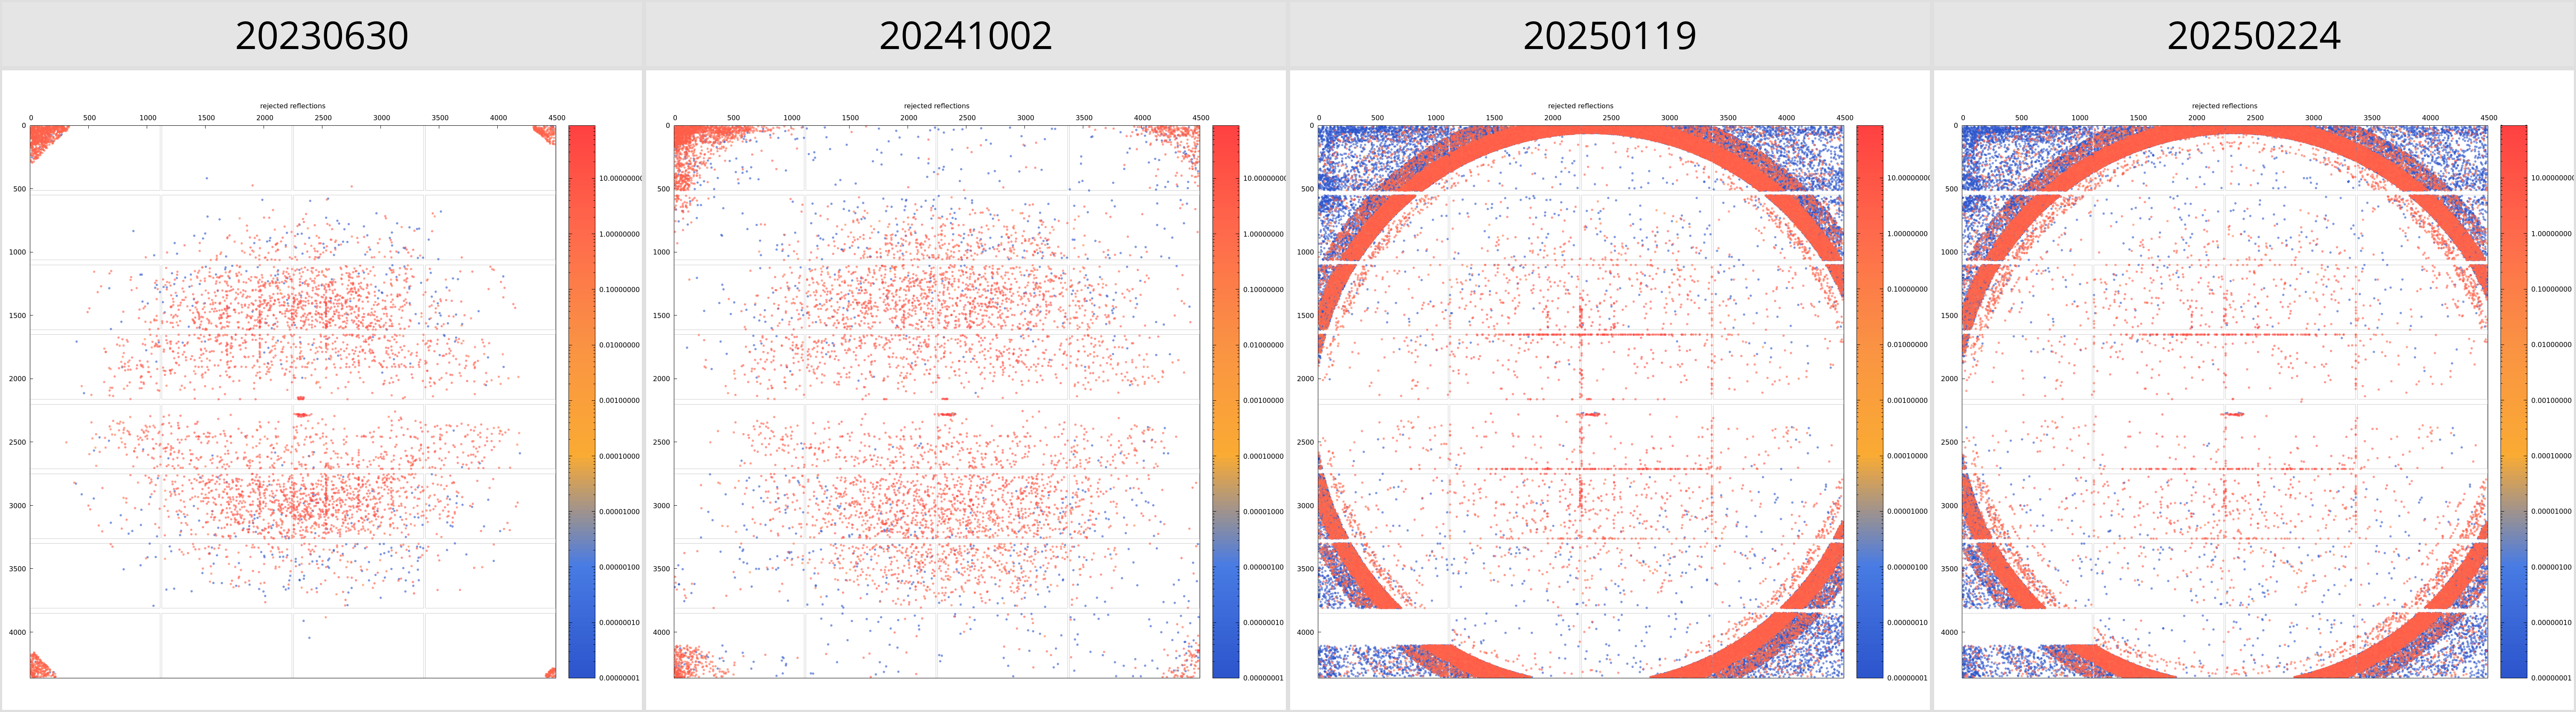 |
| 8DA3 | 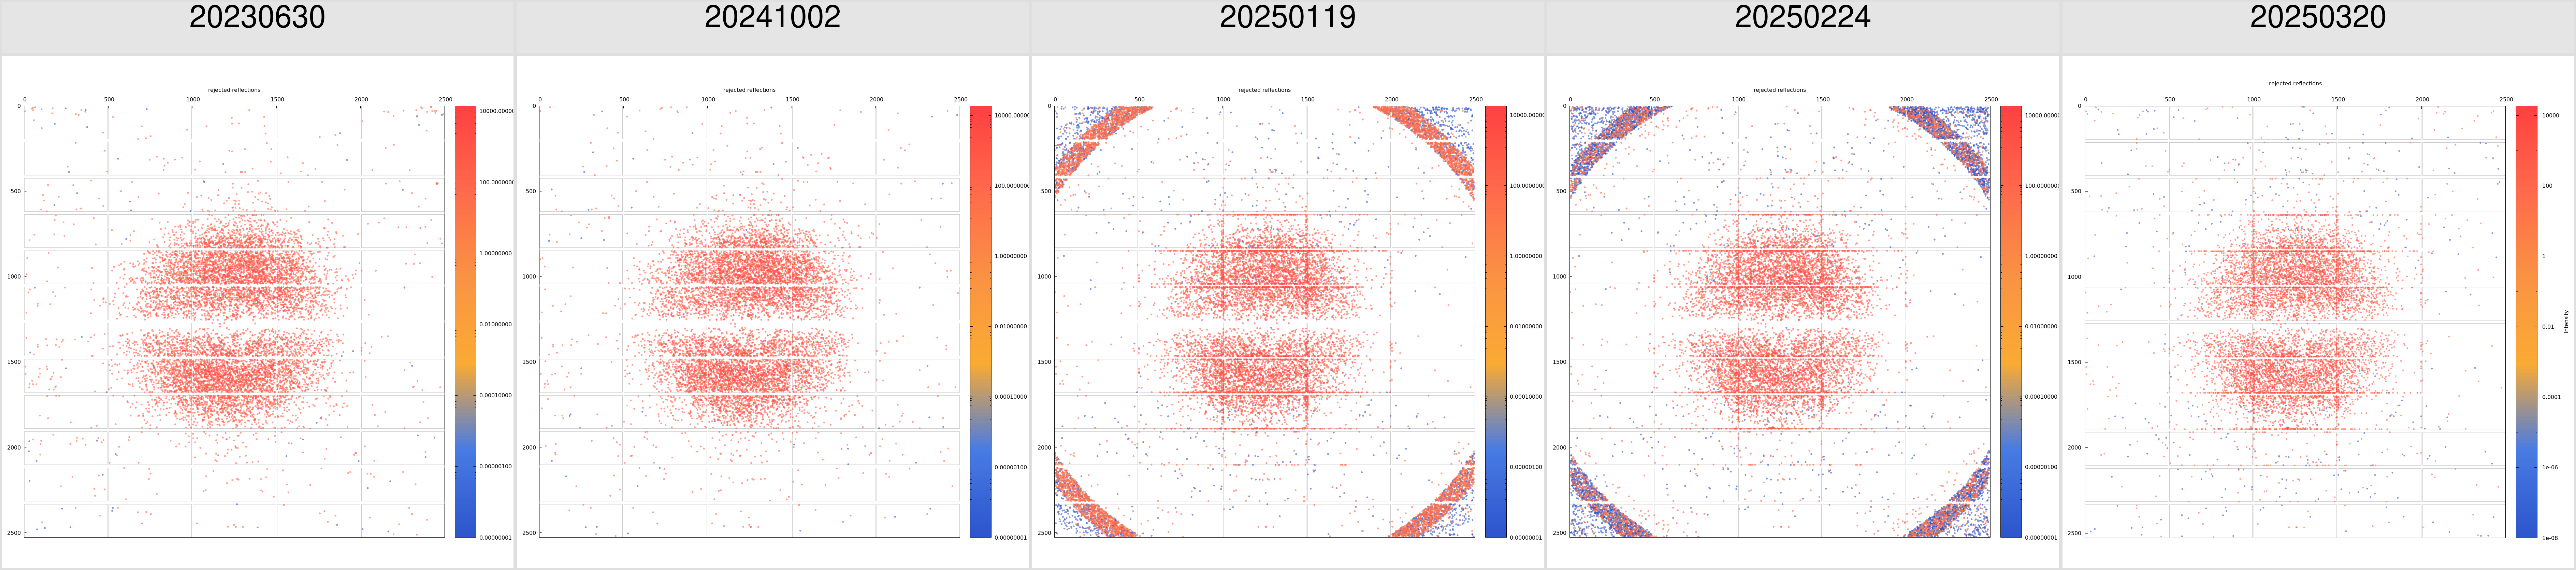 |
| 8EGN | 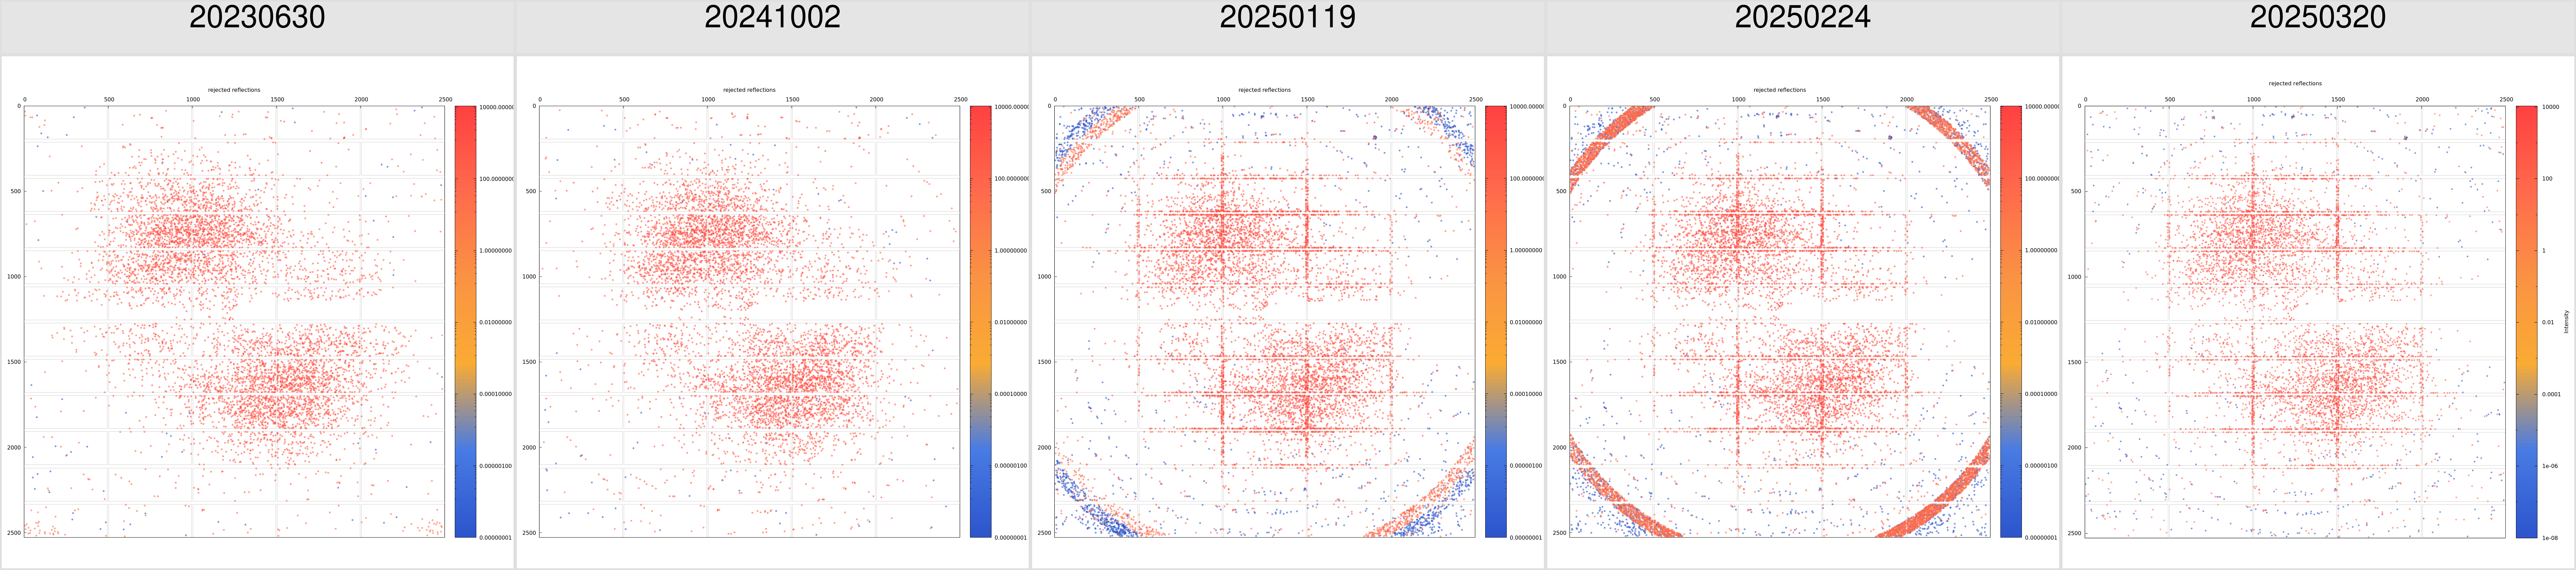 |
| 8EPS | 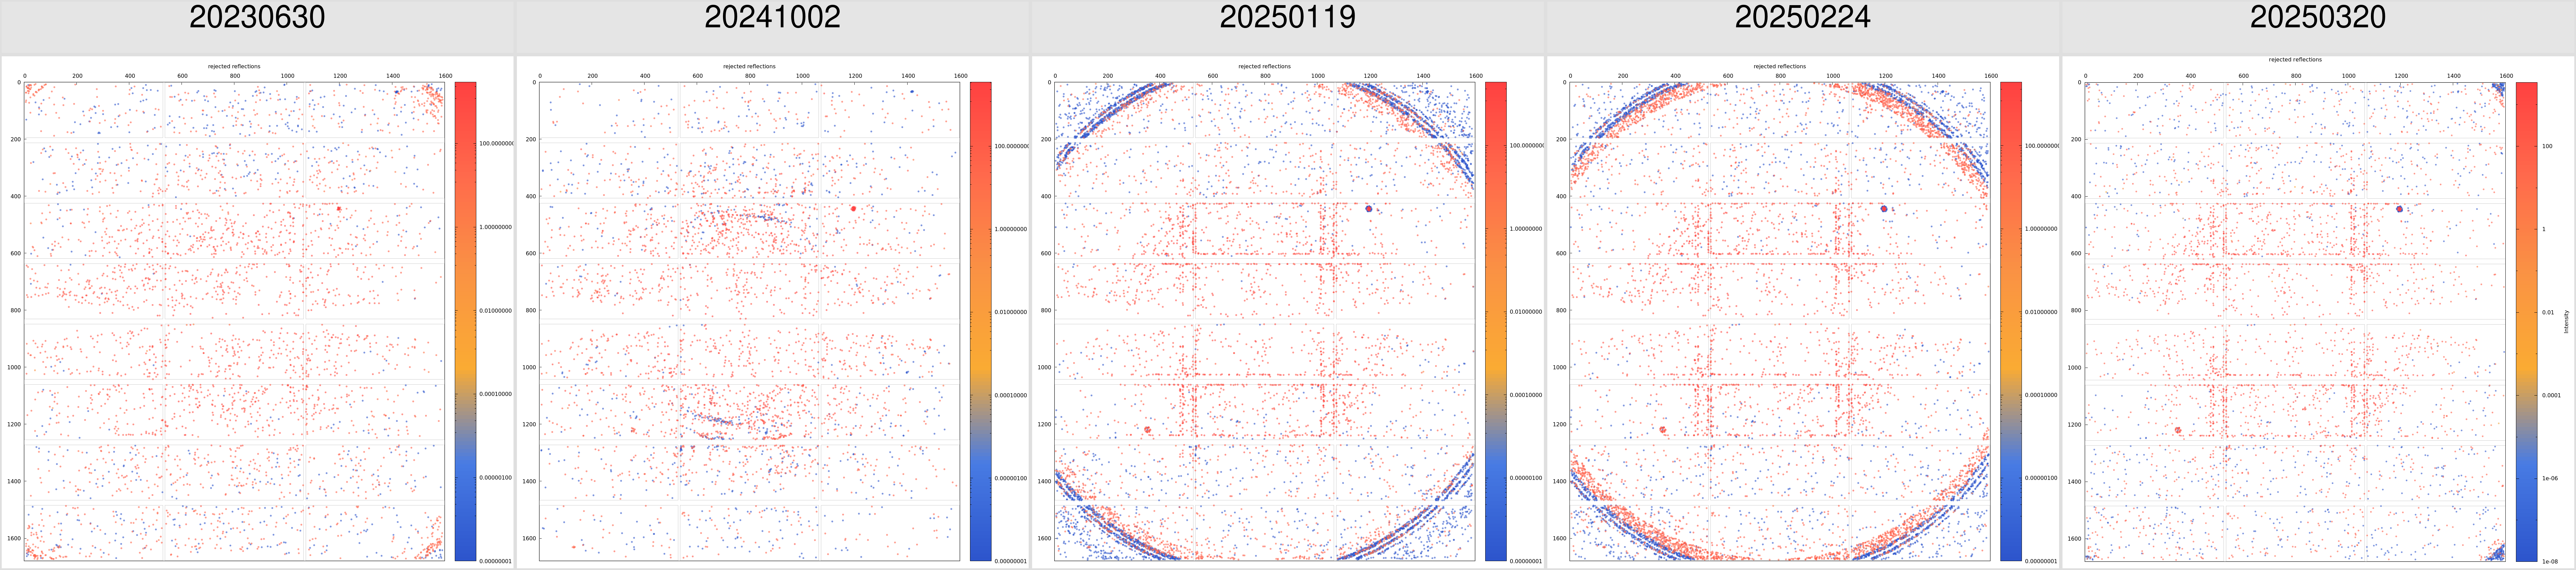 |
| 8EW7 | 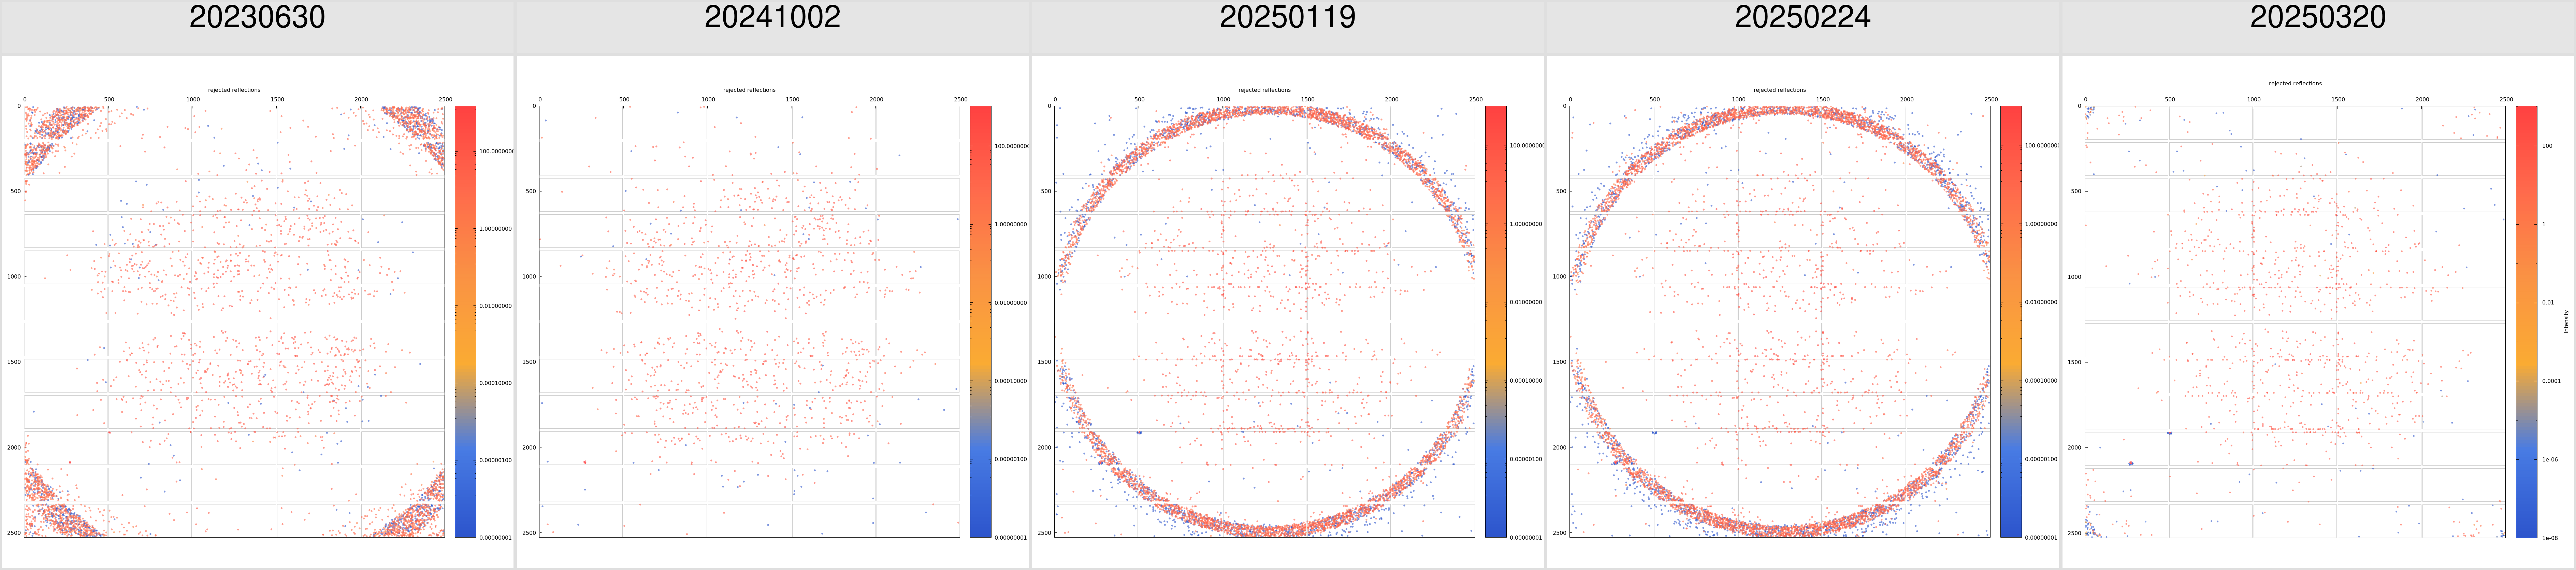 |
| 8FG7 | 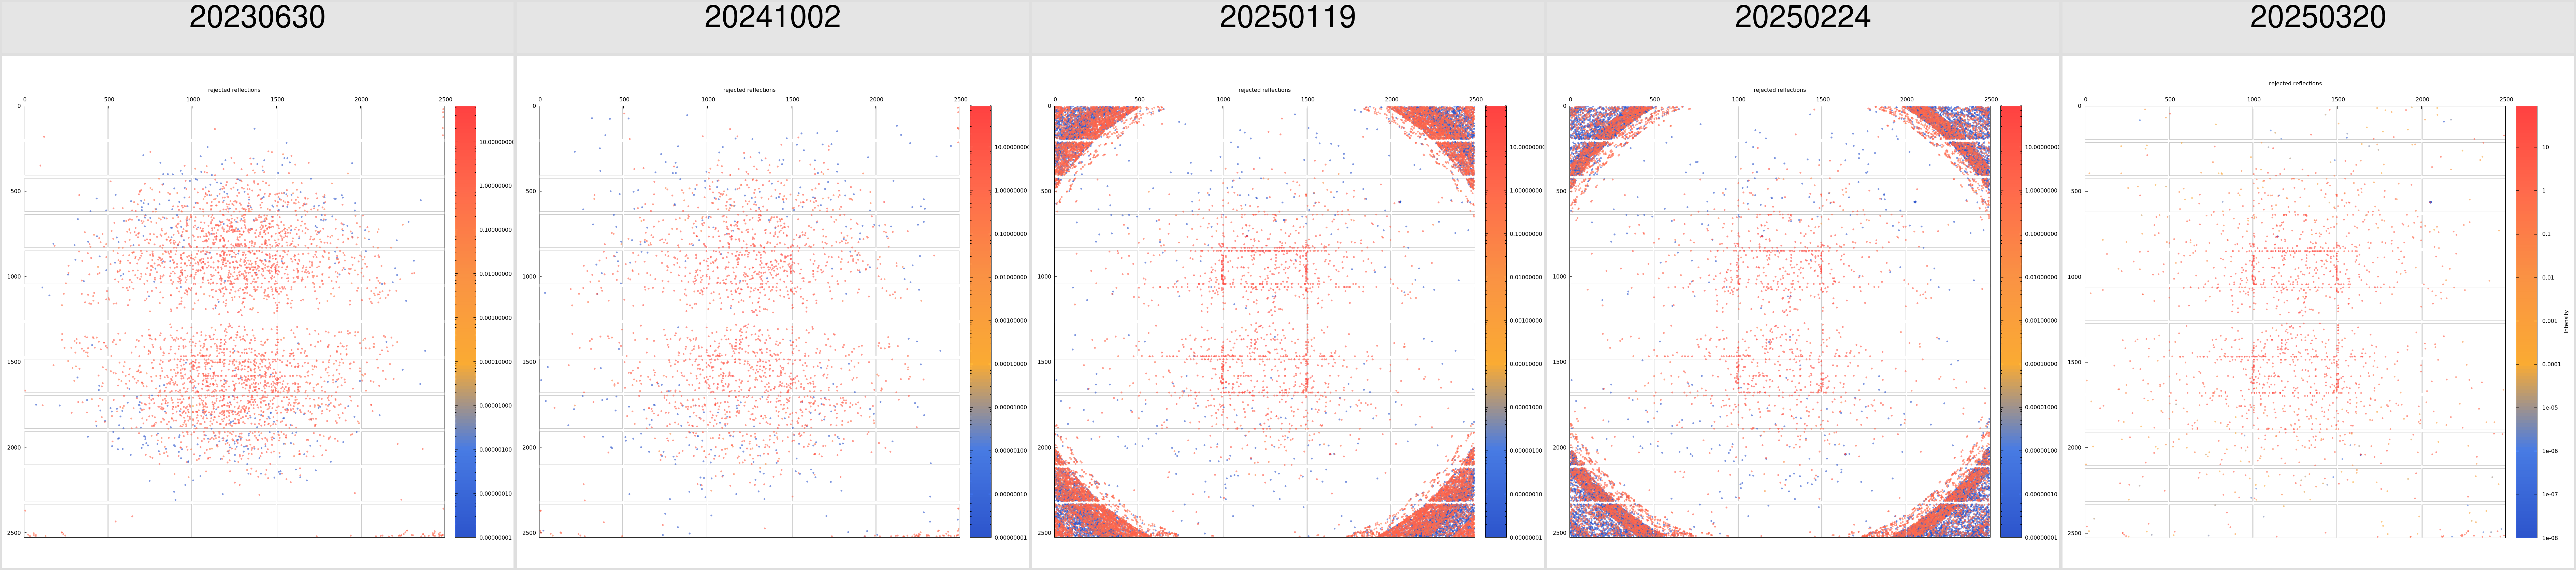 |
| 8FT8 | 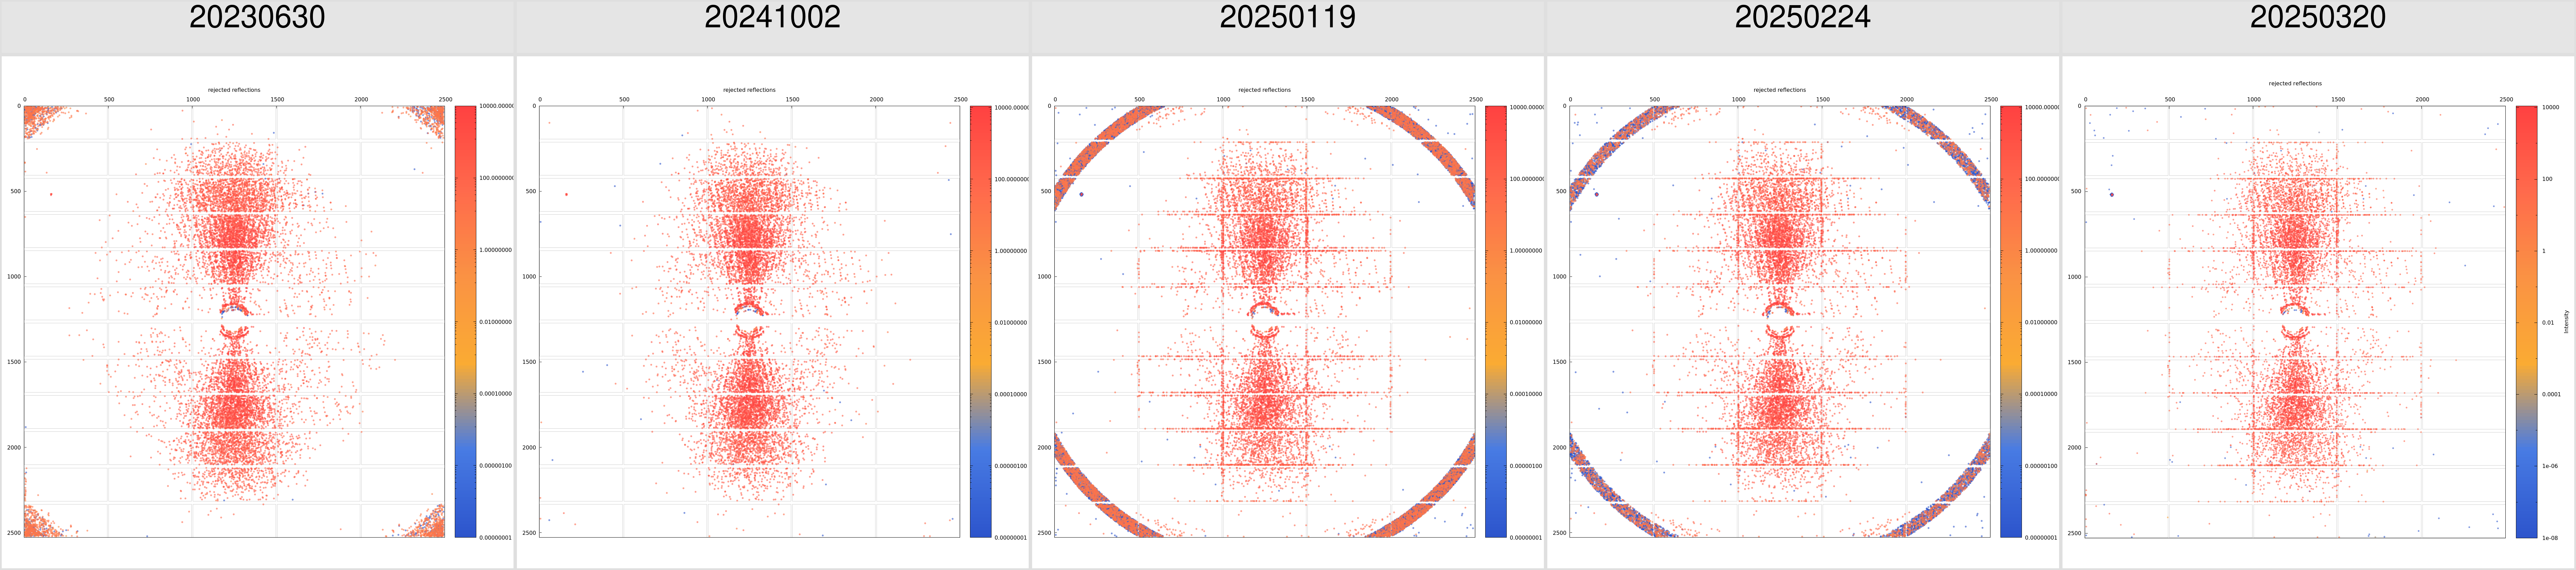 |
| 8GCA | 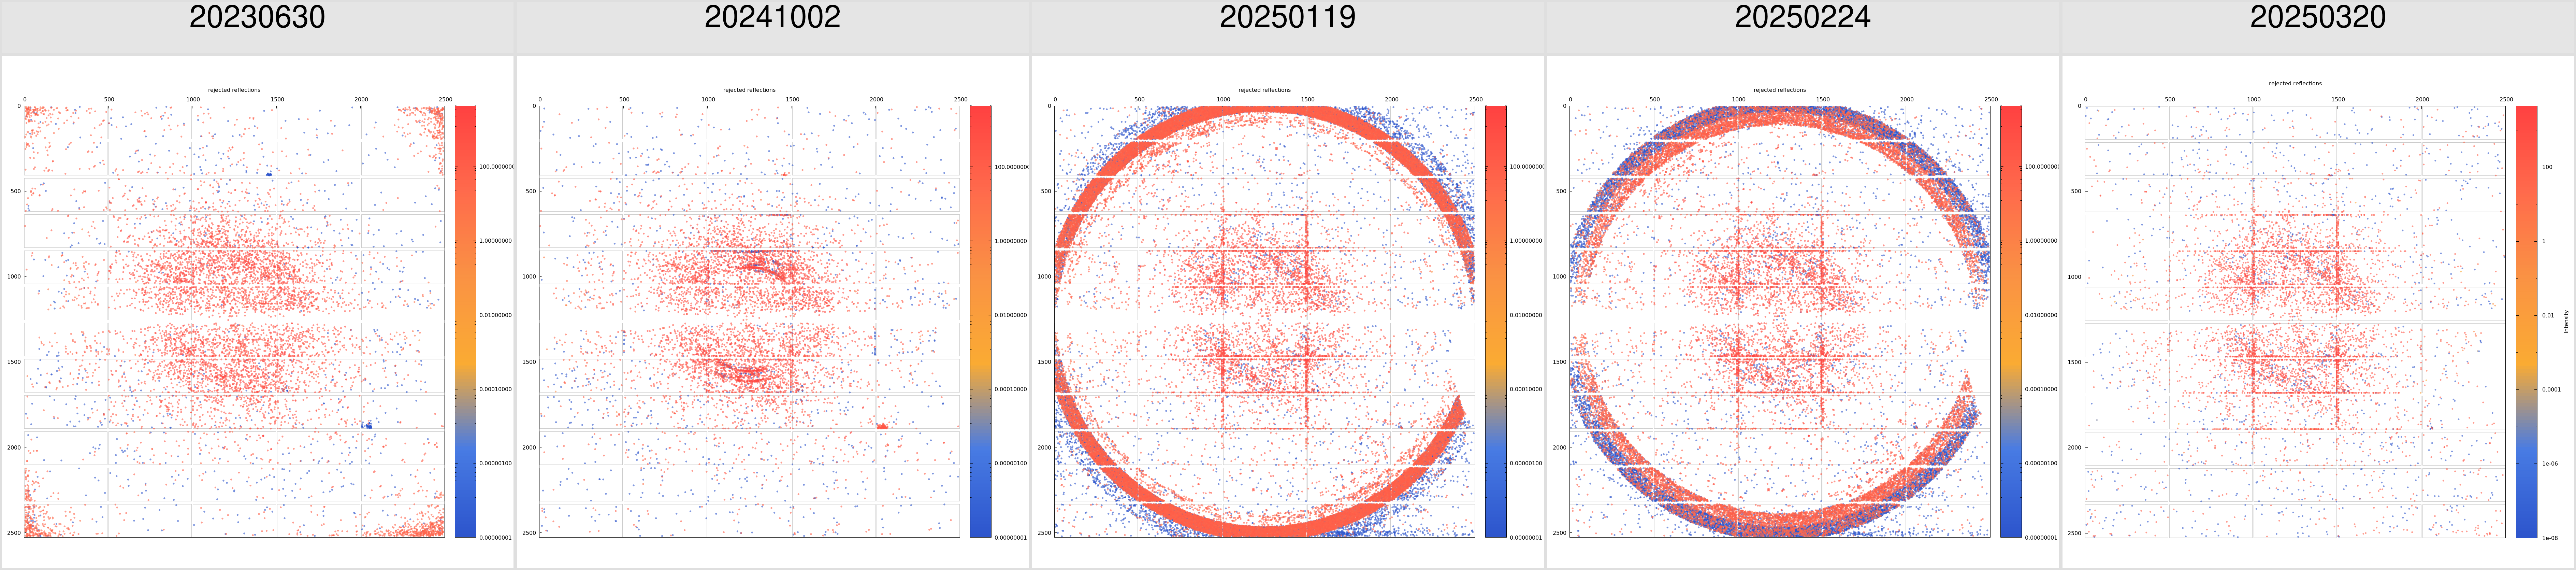 |
| 8K4Q | 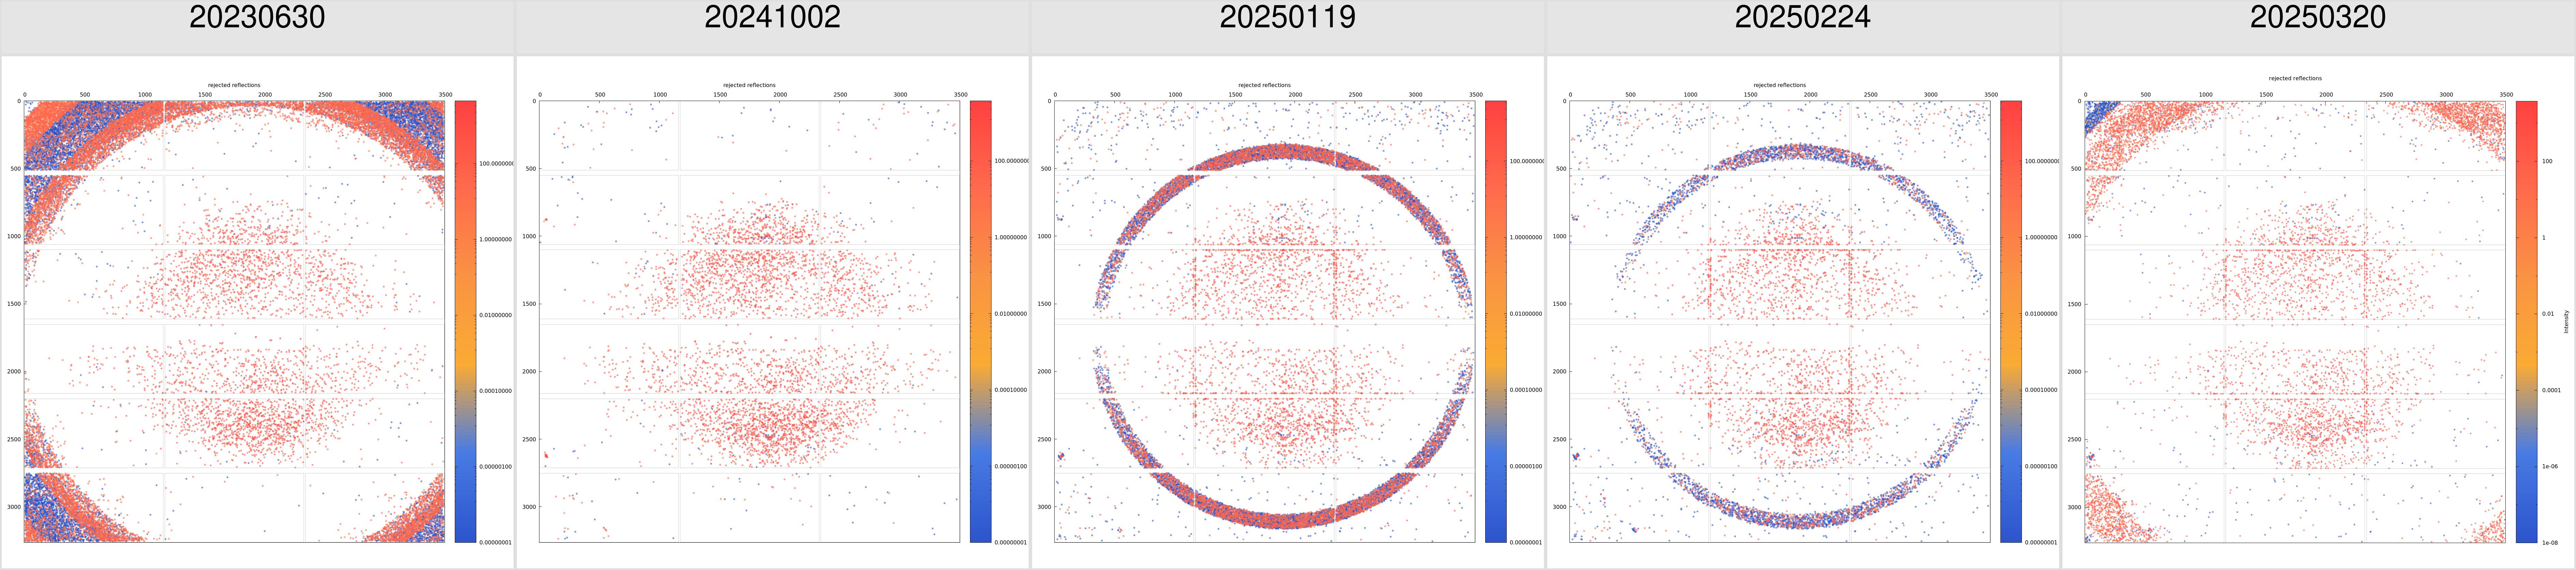 |
| 8PQC | 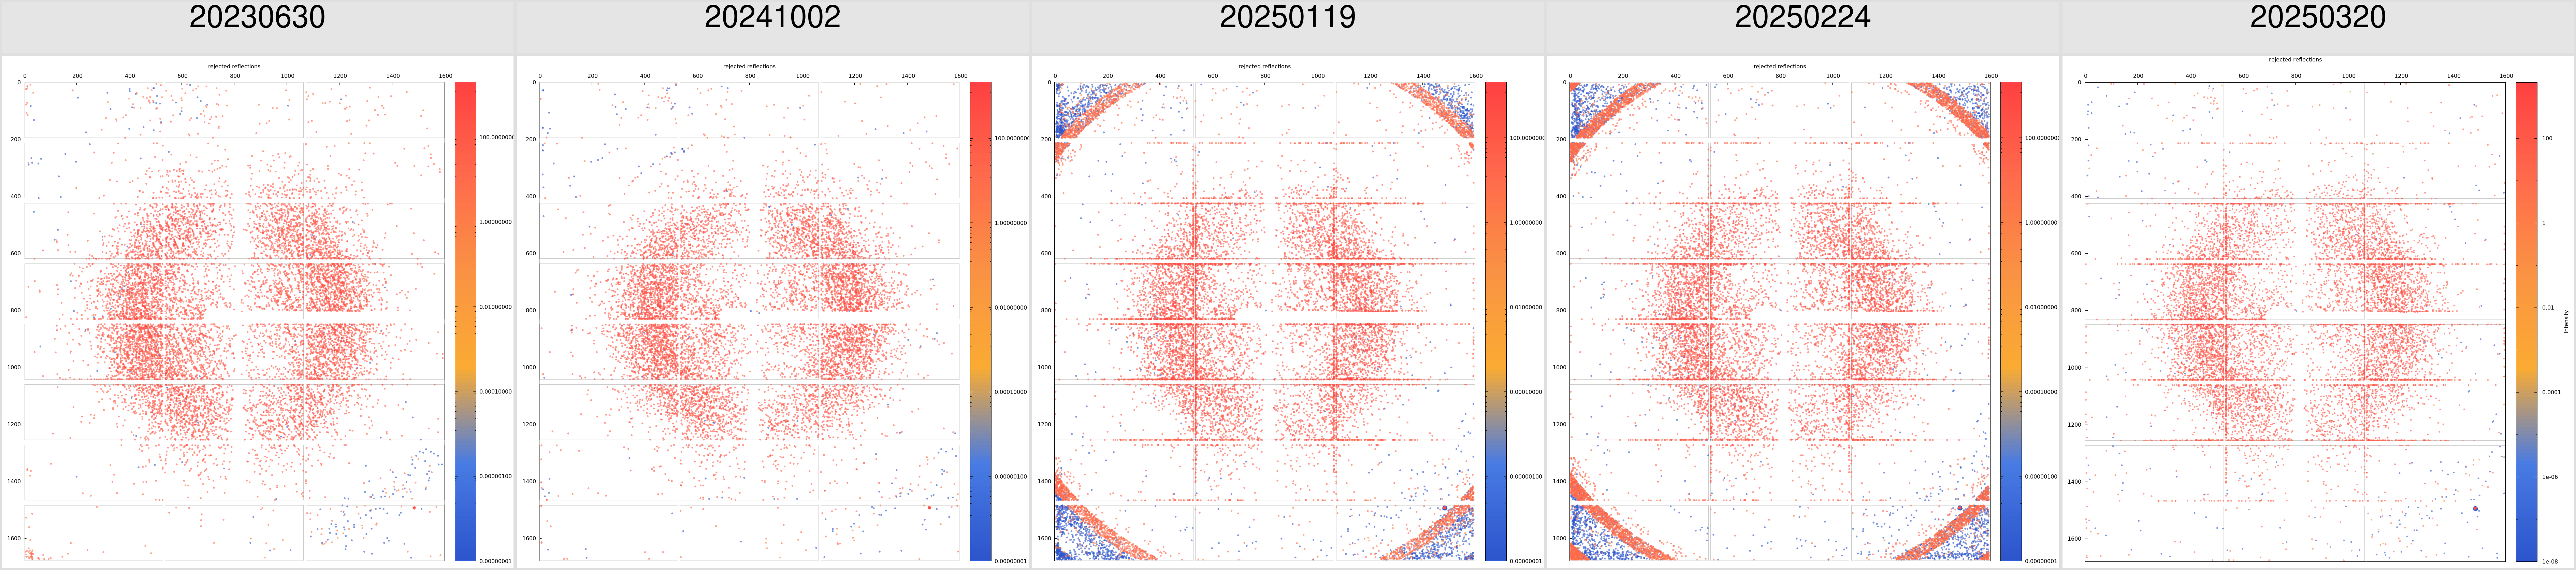 |
| 8R5Q | 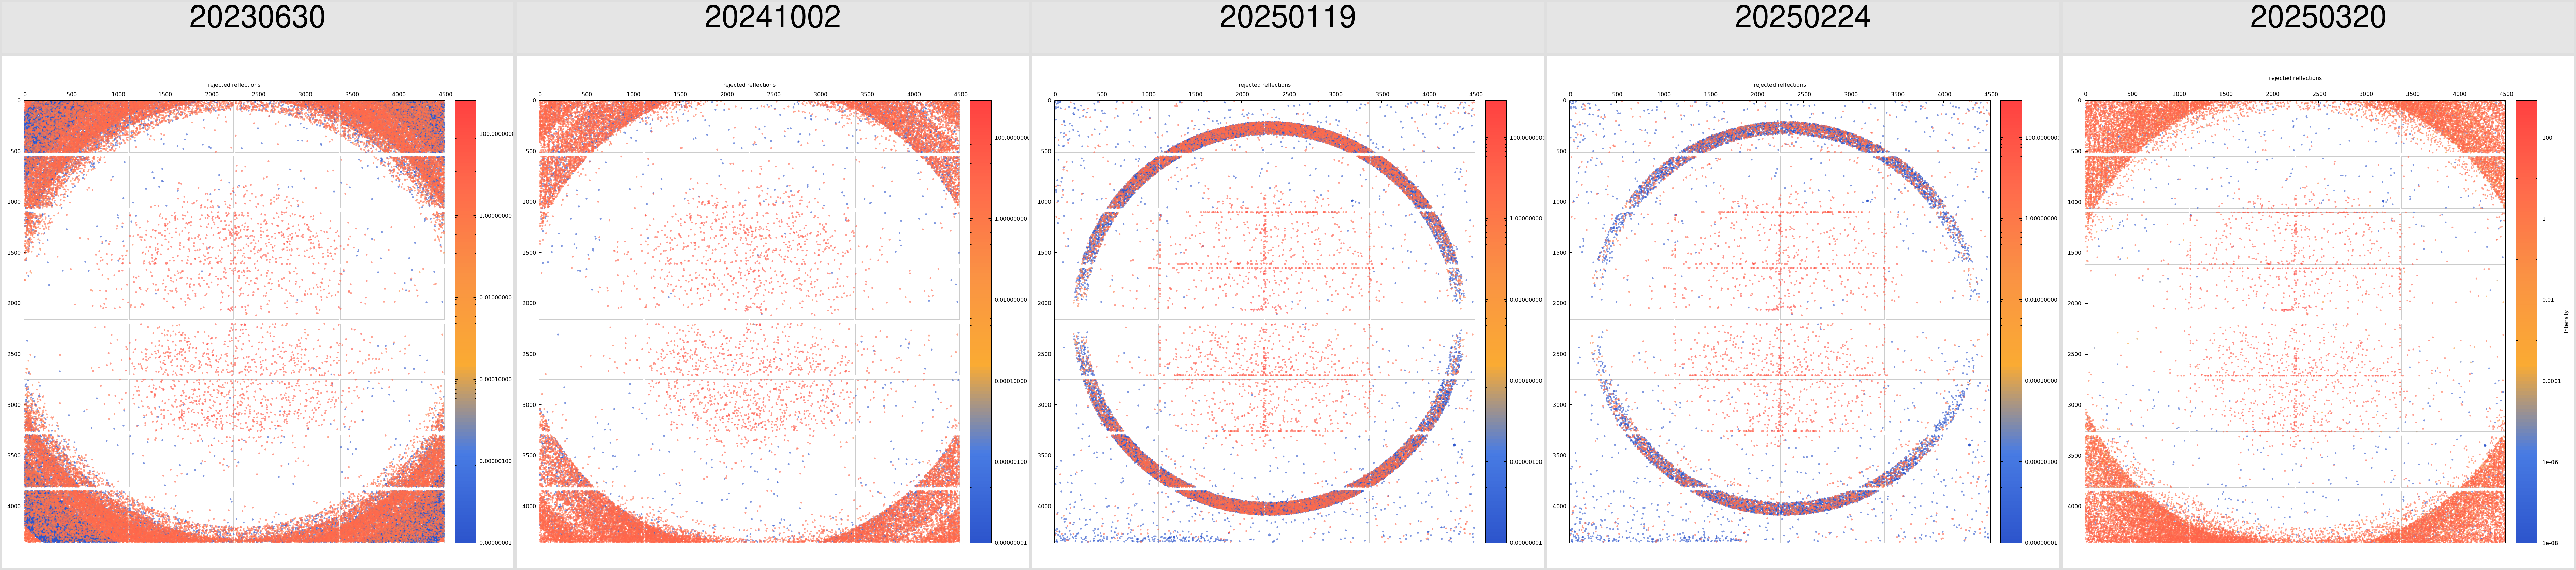 |
| 8RCC | 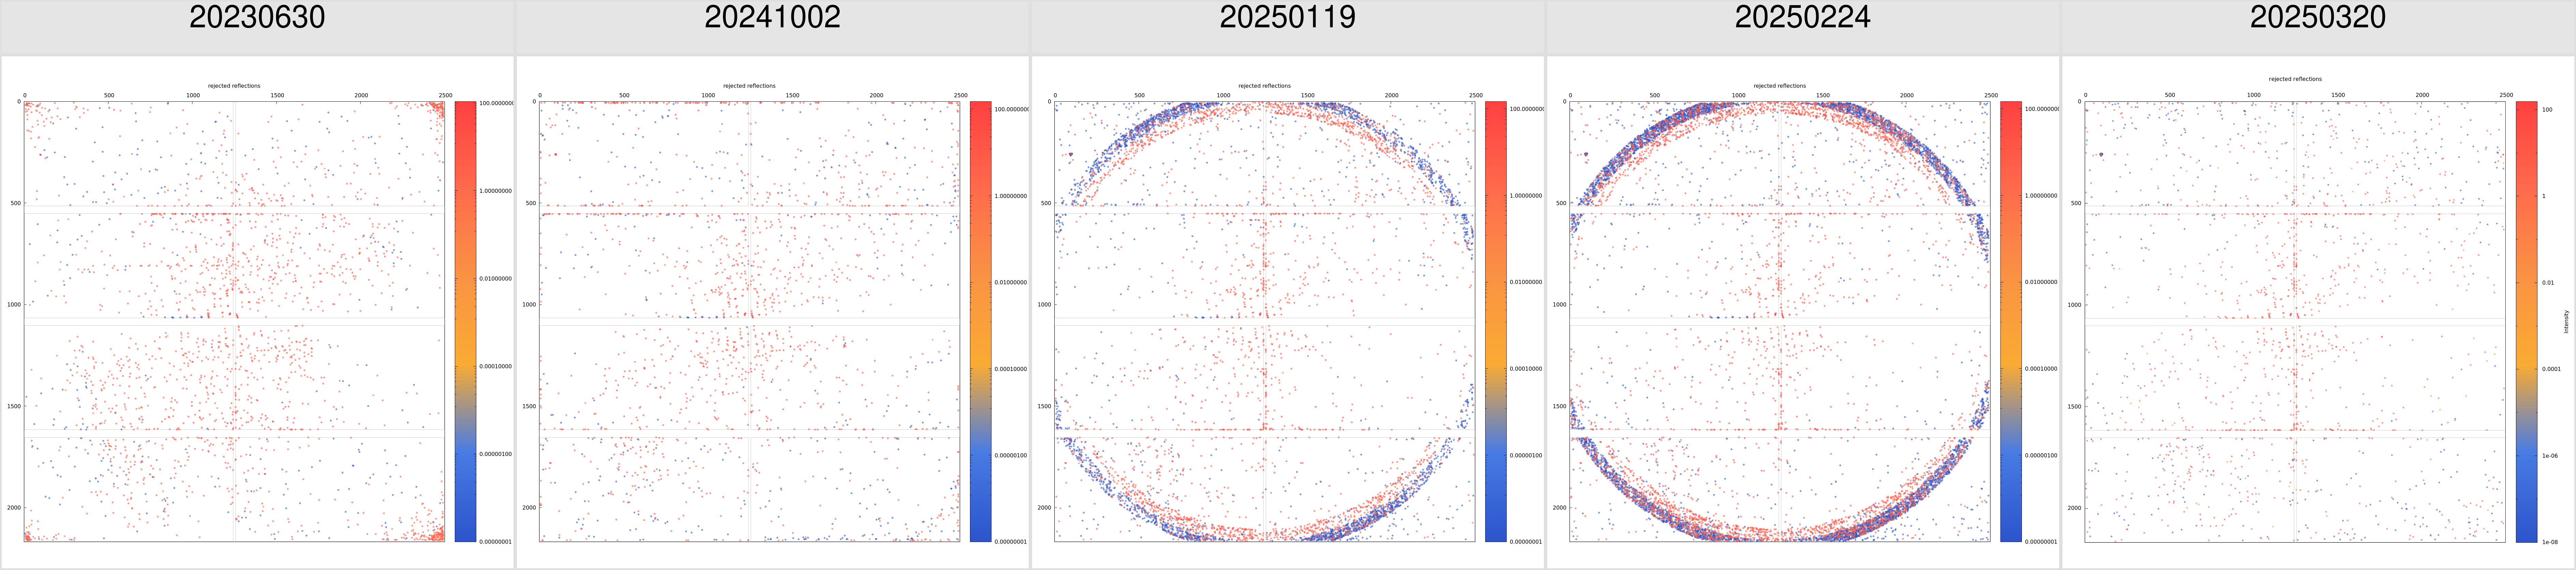 |
| 8SDW | 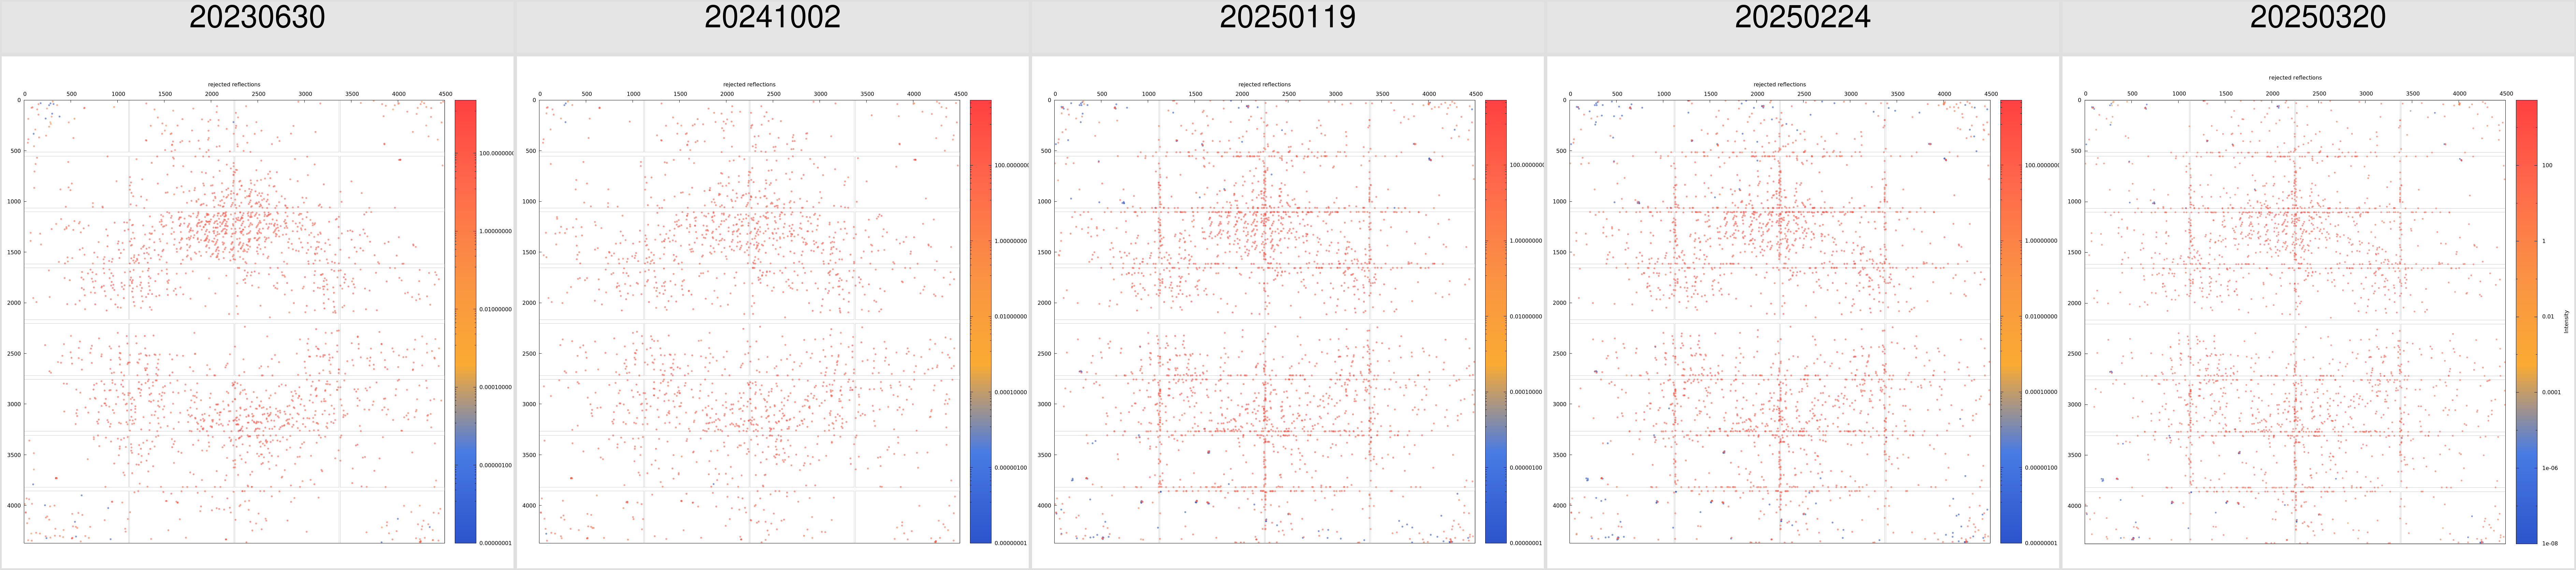 |
| 8SHR | 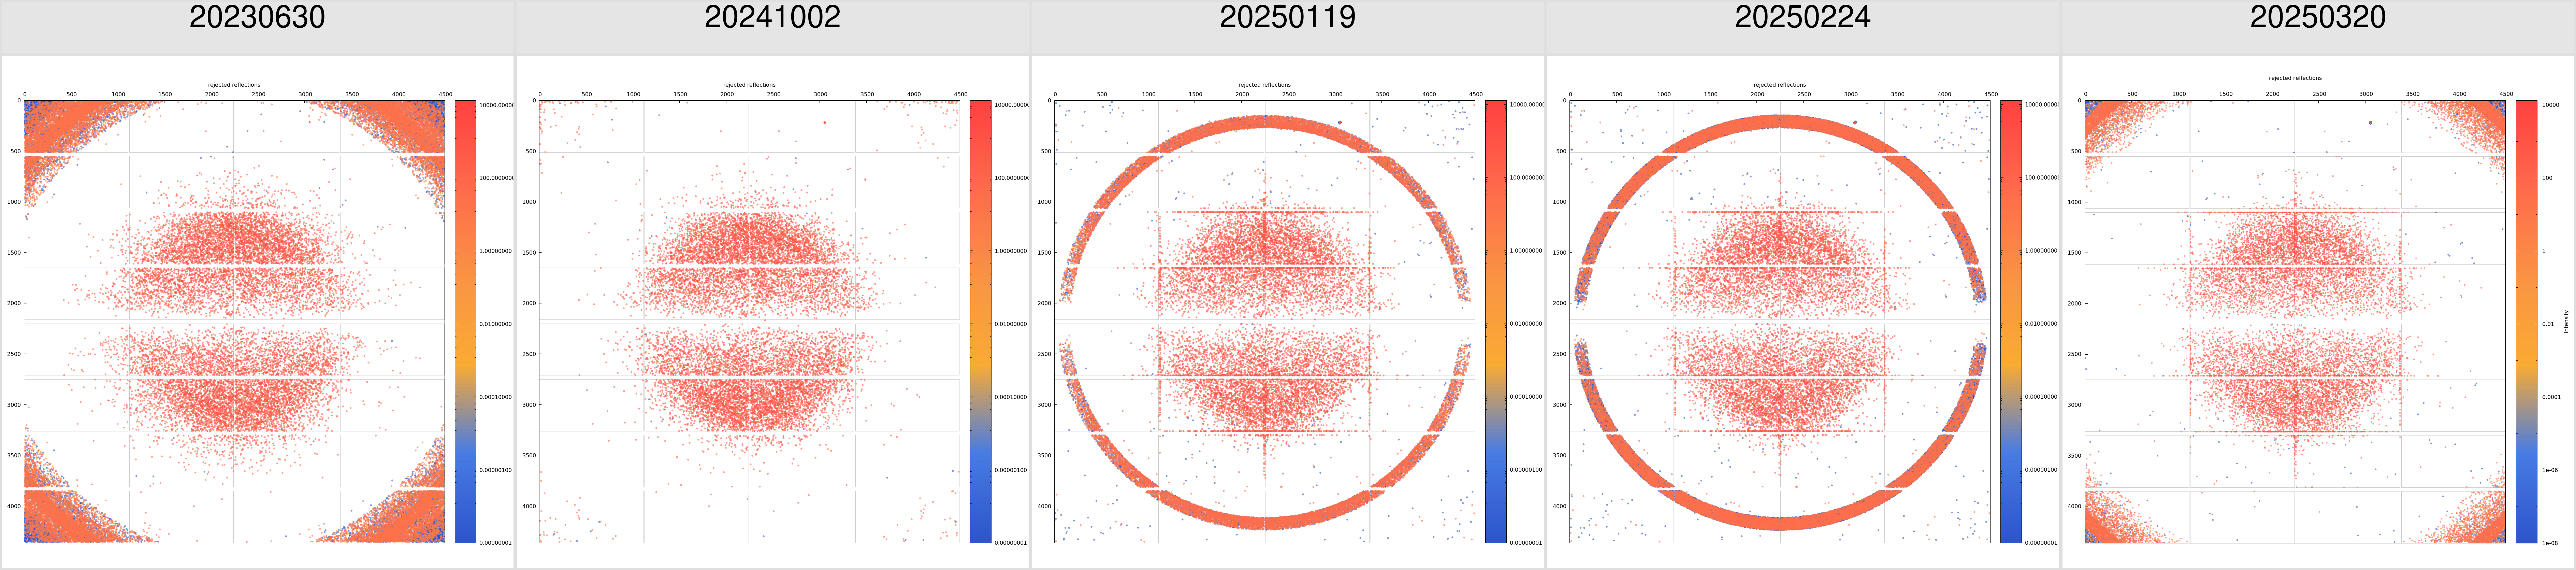 |
| 8SIO | 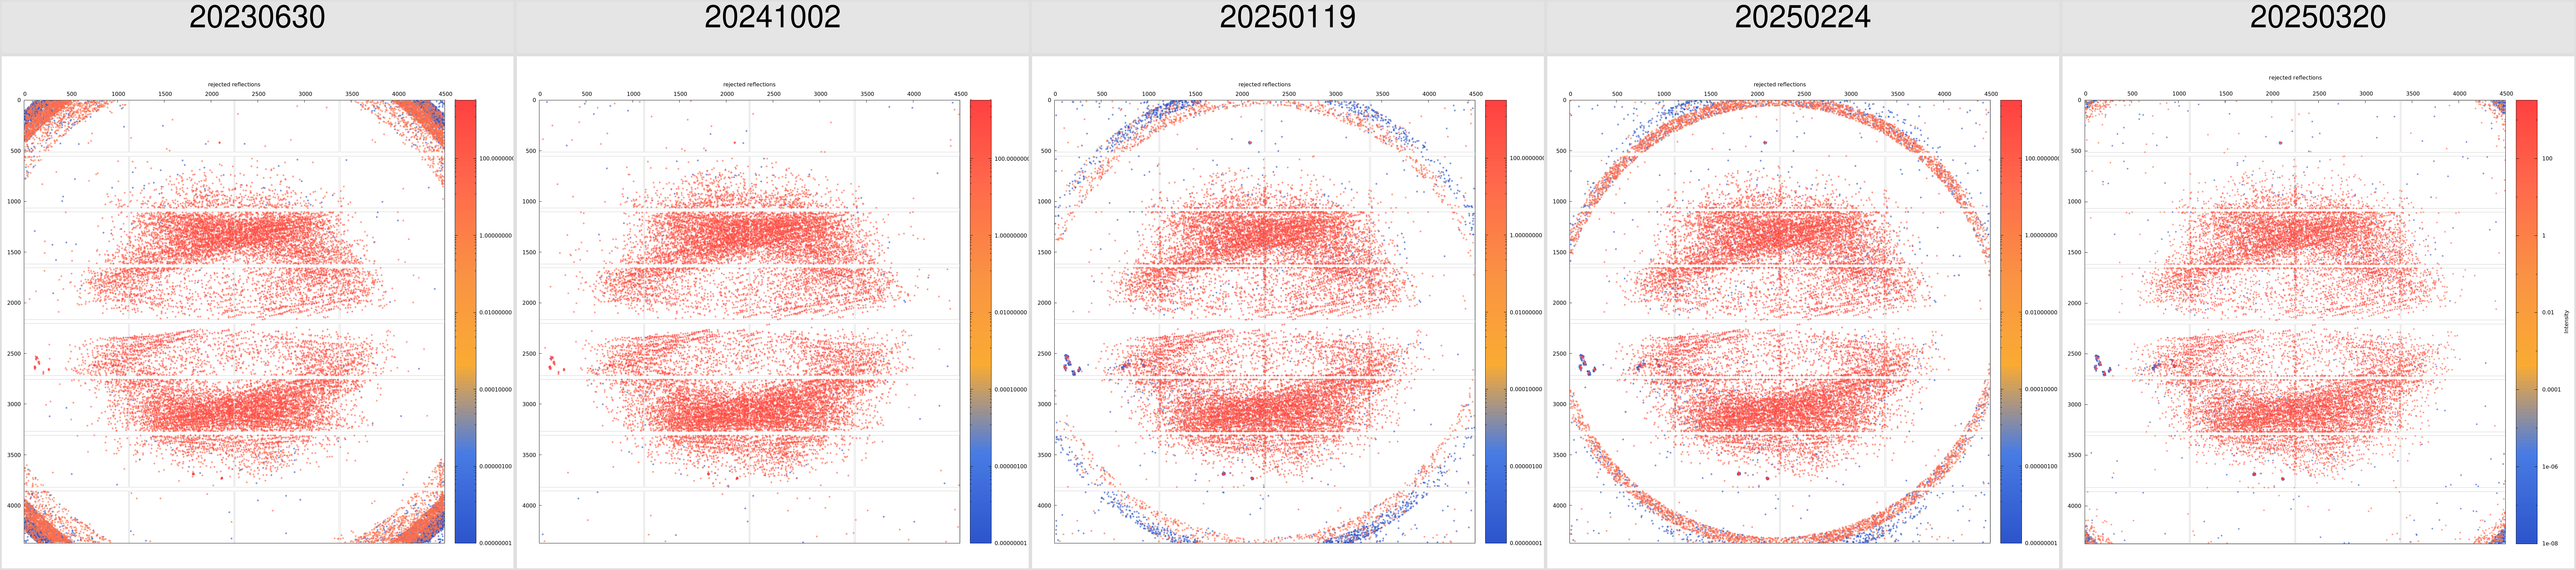 |
| 8SLU | 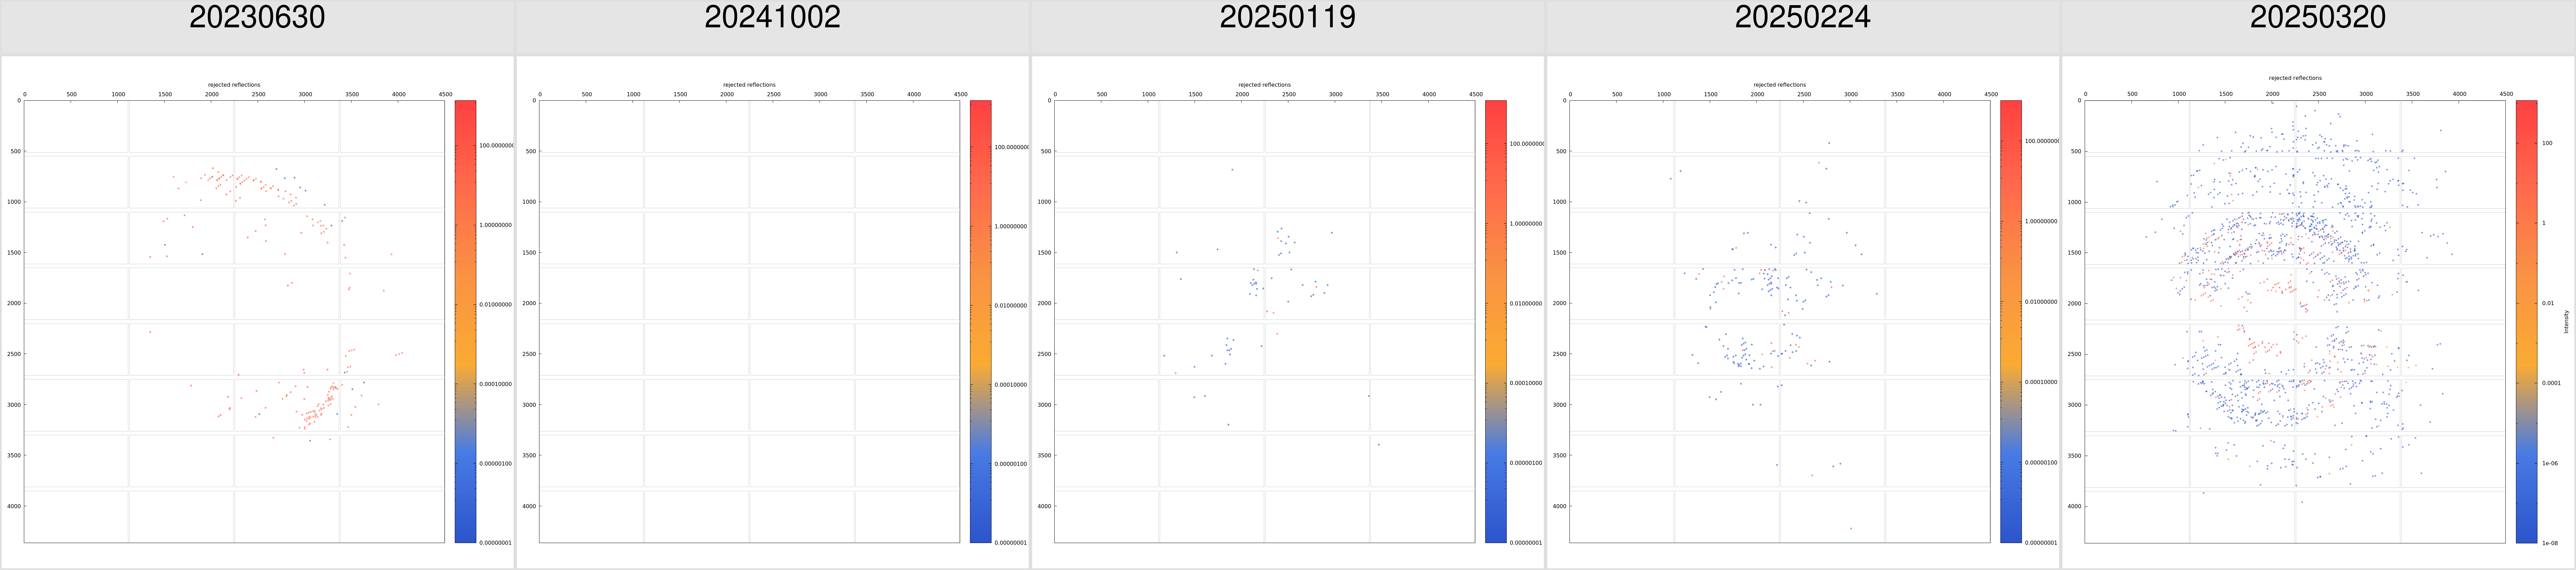 |
| 8SO5 |  |
| 8TCA | 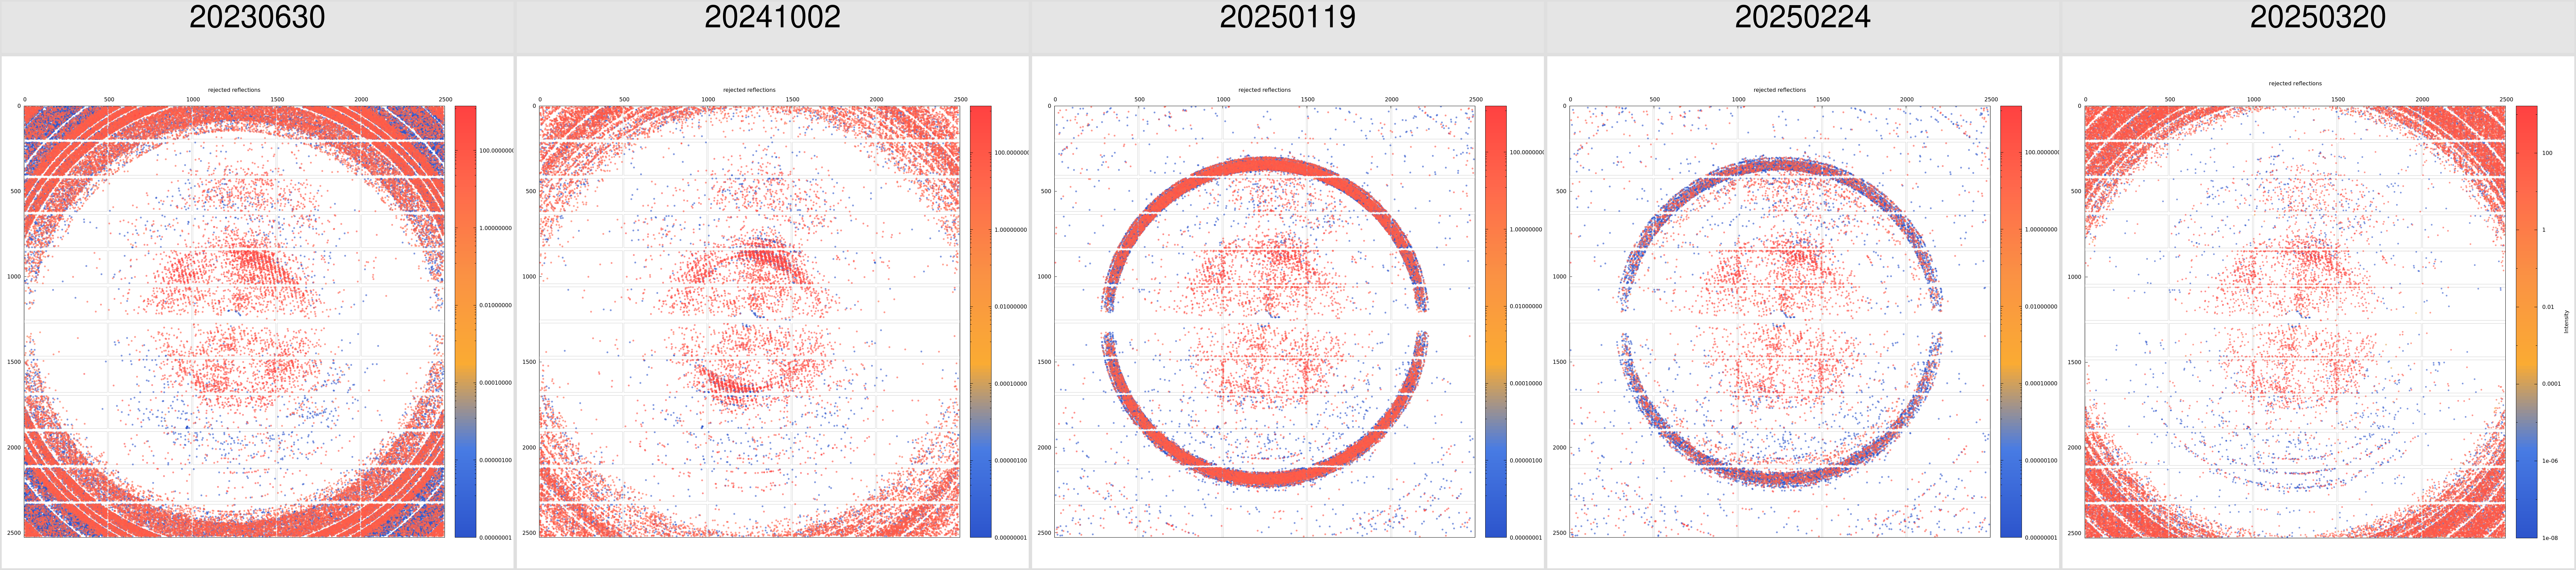 |
| 8UFN | 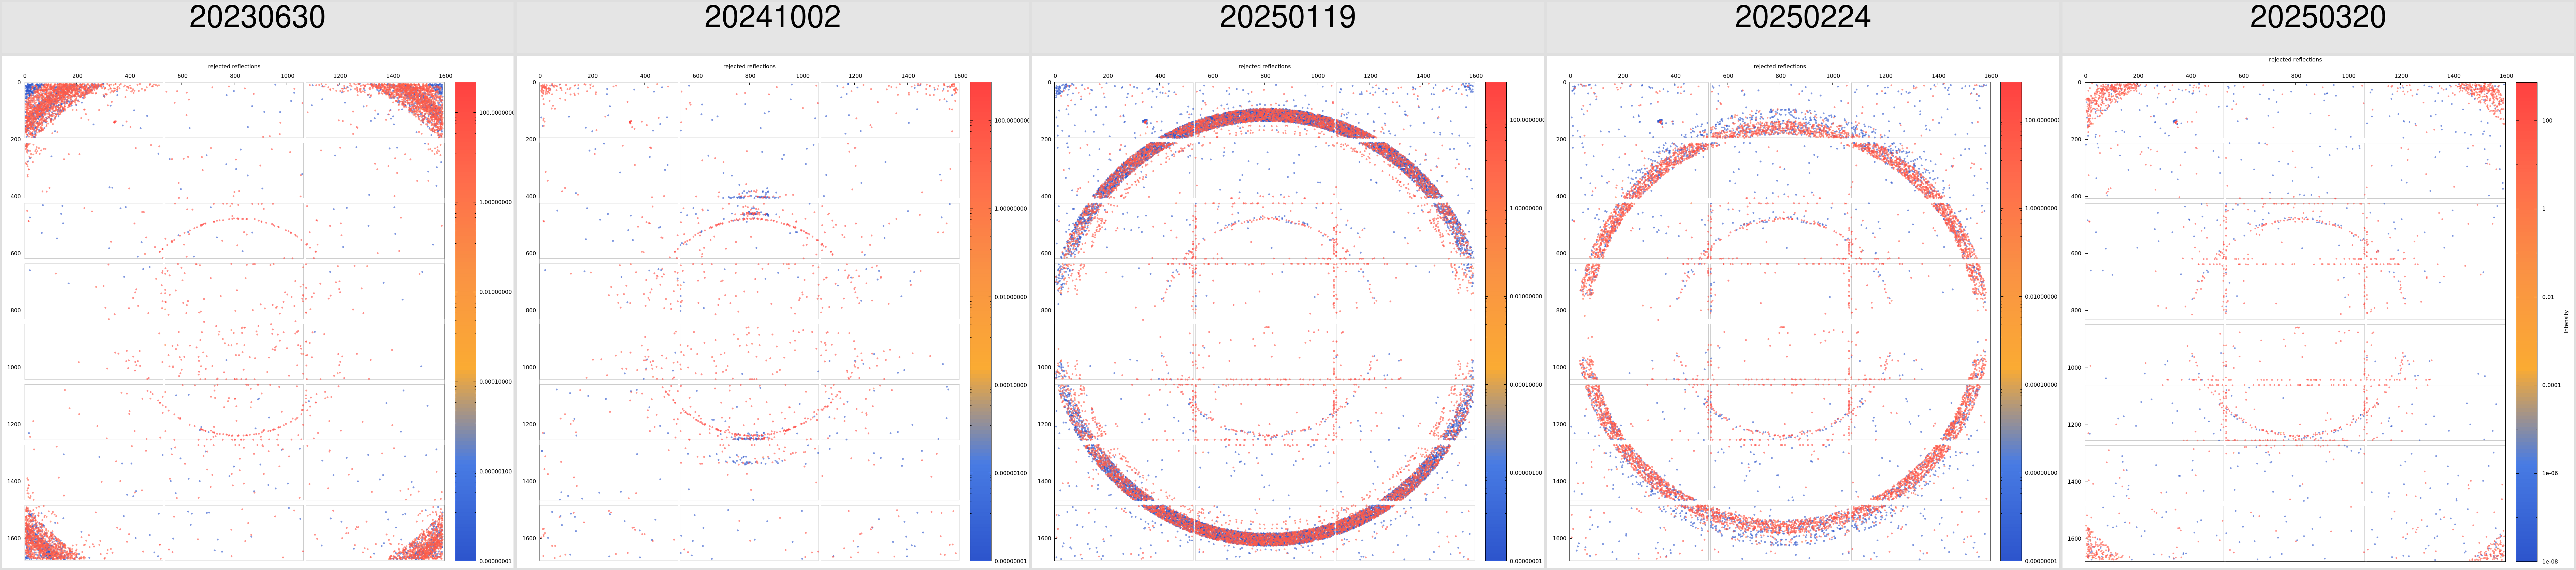 |
| 8VEV | 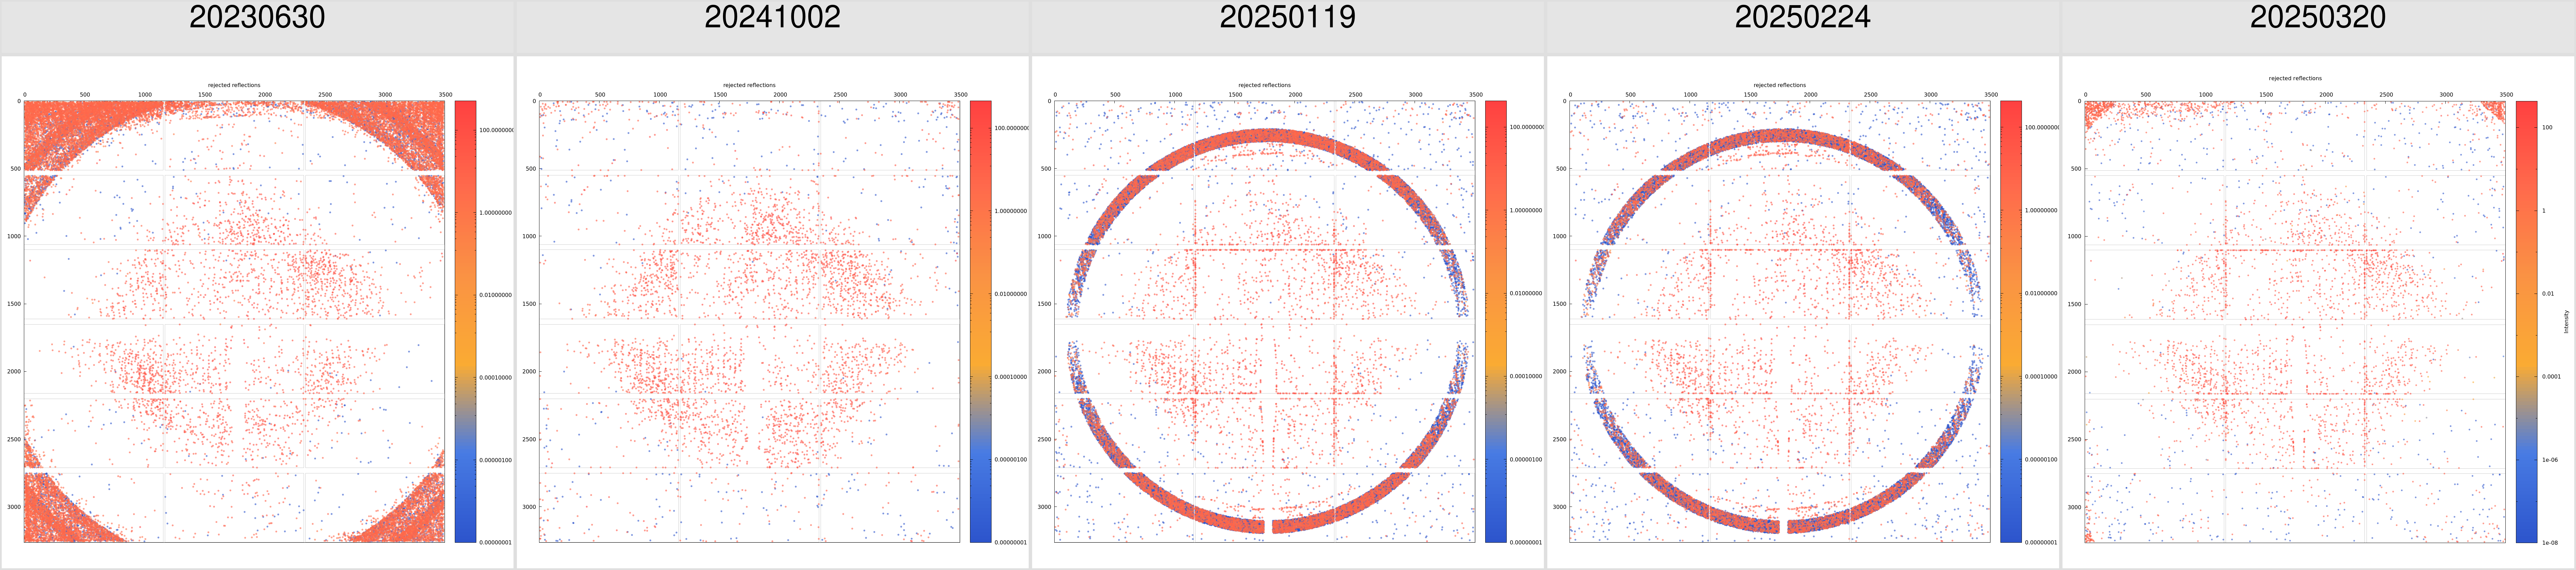 |
| 8WT3 | 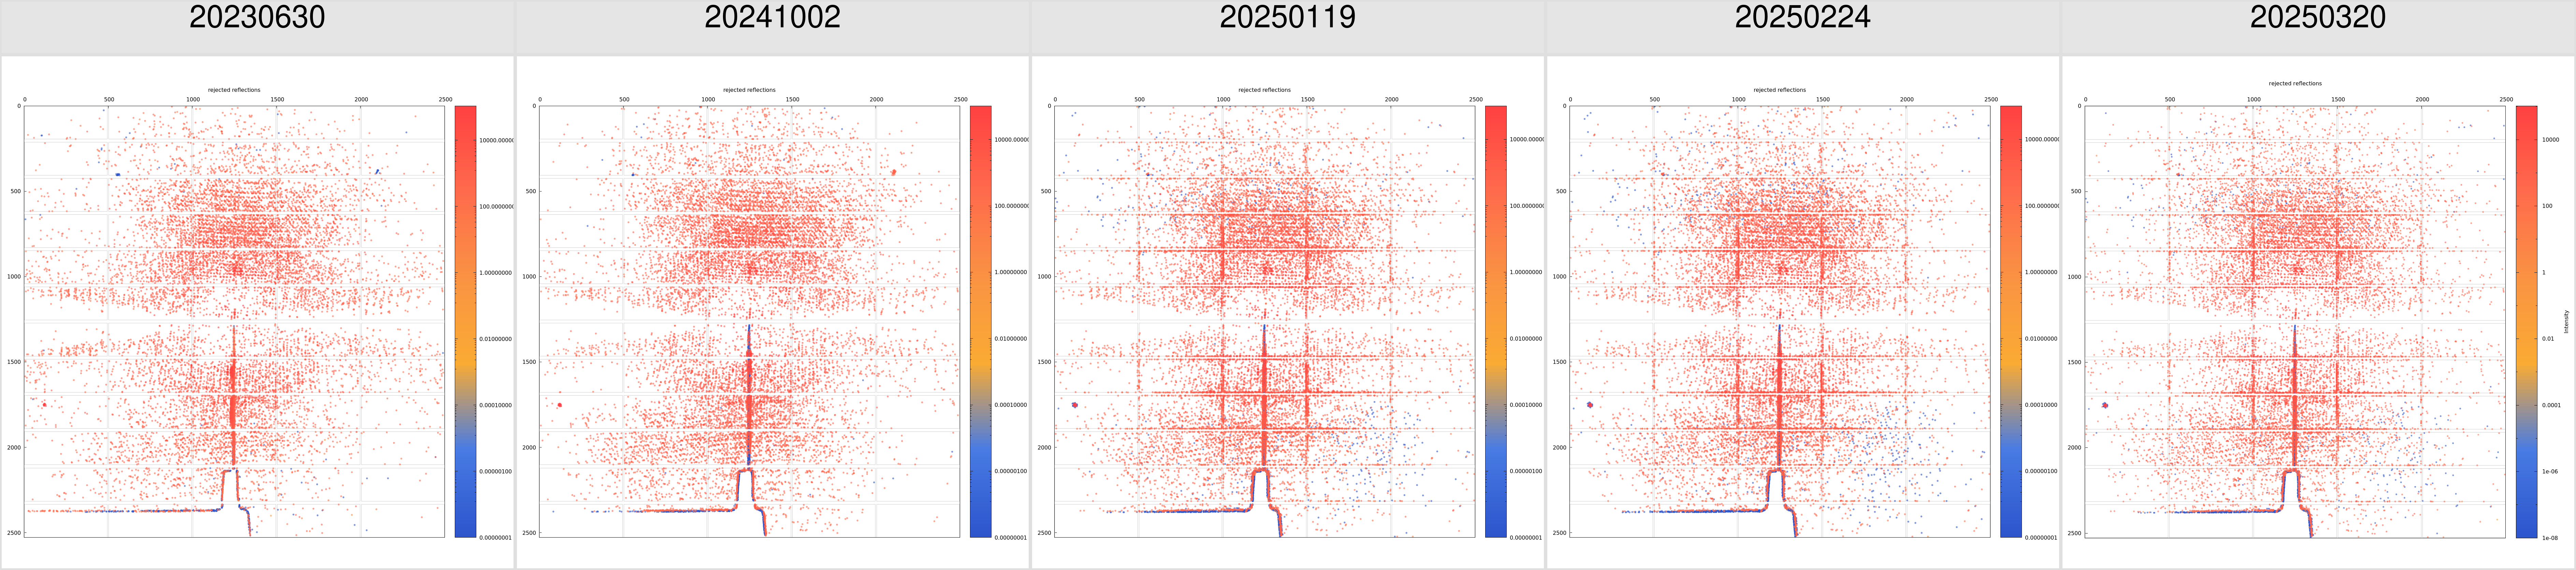 |
| 9CPL | 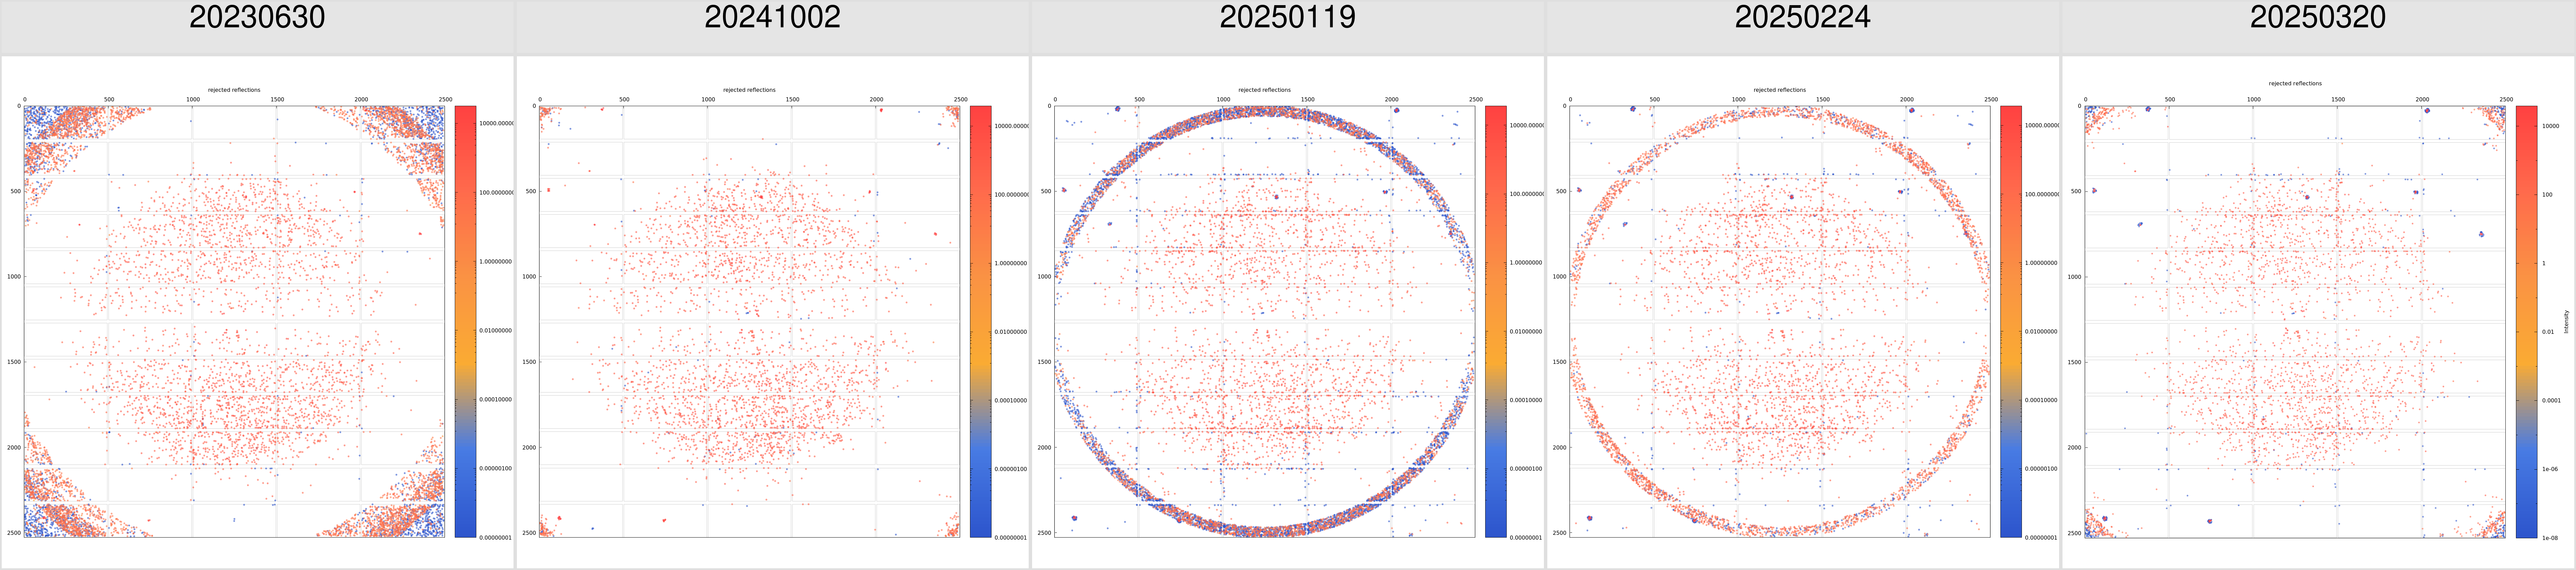 |
Visually inspecting those comparisons:
- There seem to be more rejections along module boundaries with all 2025 versions.
- The early 2025 versions show some circular/radial rejection patterns that are difficult to understand:
- these are not triggered by ice- or powder-rings
- we assume that the outlier detection in CORRECT has not changed and that these are due to changes in the incoming data from INTEGRATE
- The latest 20250320 version often differes substantially from the other 2025 versions (apart from the higher number of rejections along module gaps)
- Sometimes the rejections patter looks more similar to the 20230630 version ...
- ... but not always - and sometimes it shows a completely new pattern altogether.
Wilson plots
Taking the XDS_ASCII.HKL file from XDS/CORRECT, running it through XDSCONV (for merging) and then using CTRUNCATE (to calculate Wilson plots):
| 4FQN | 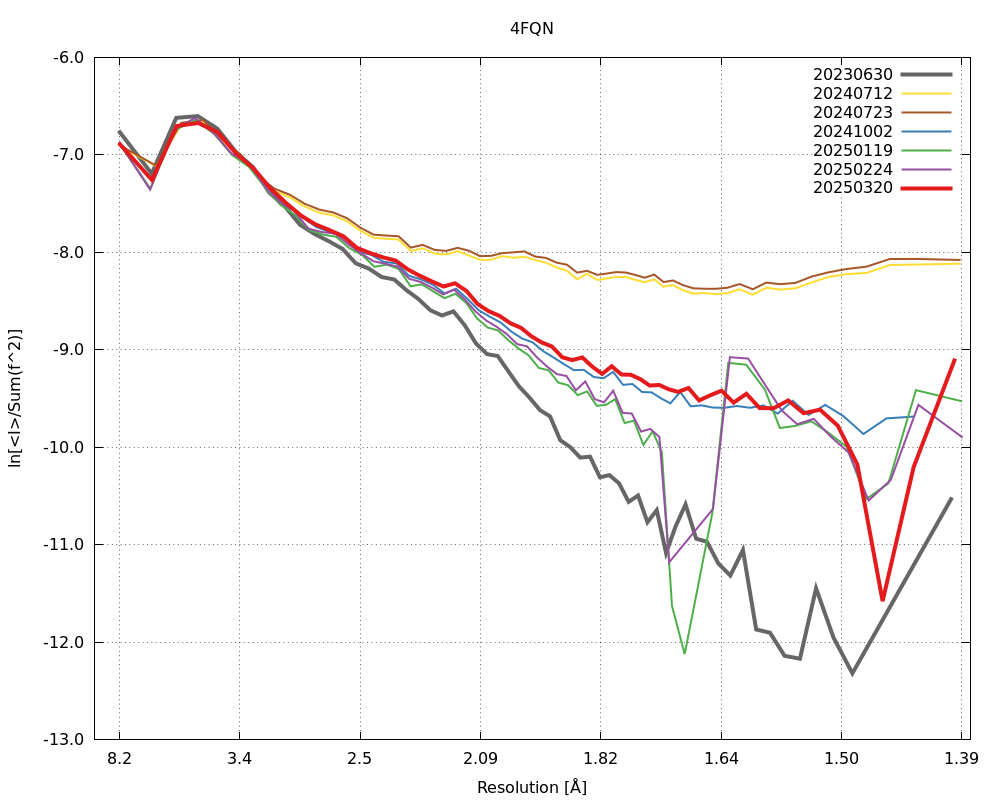 |
| 4QKI | 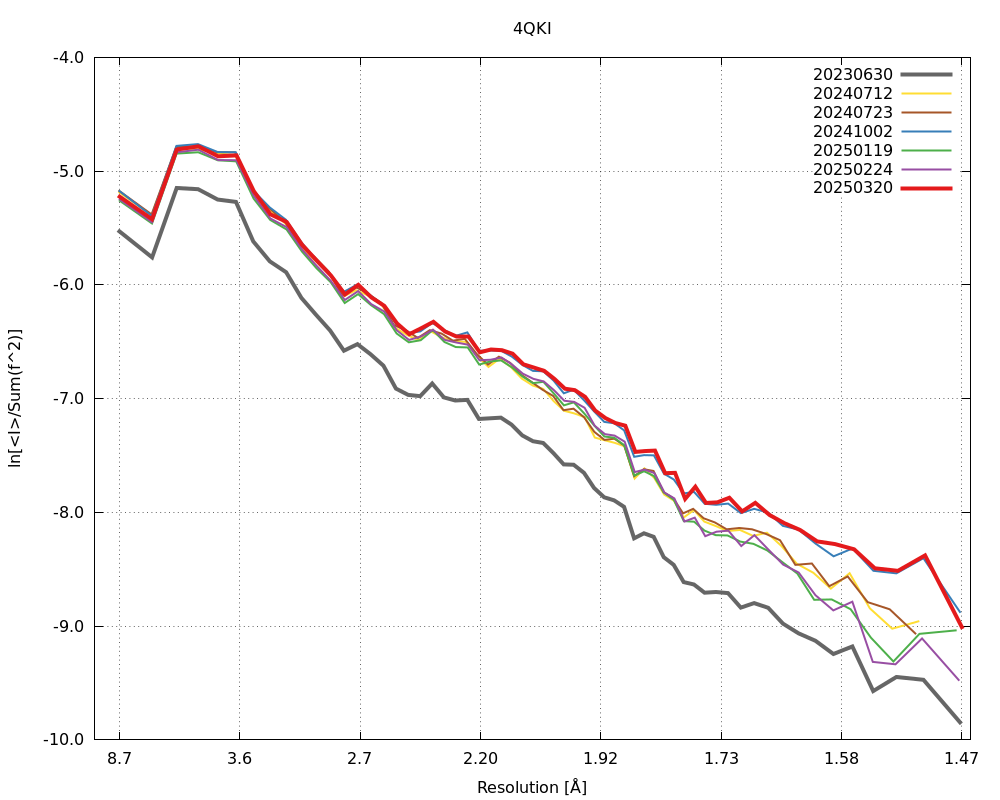 |
| 5AUI | 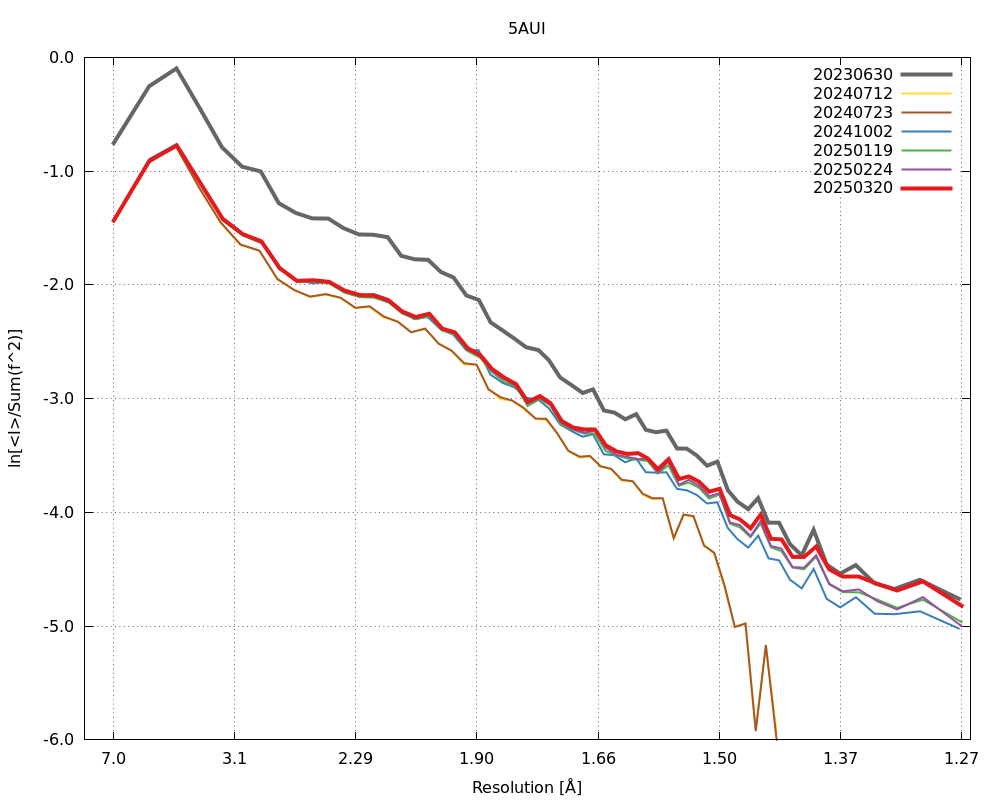 |
| 5E9I | 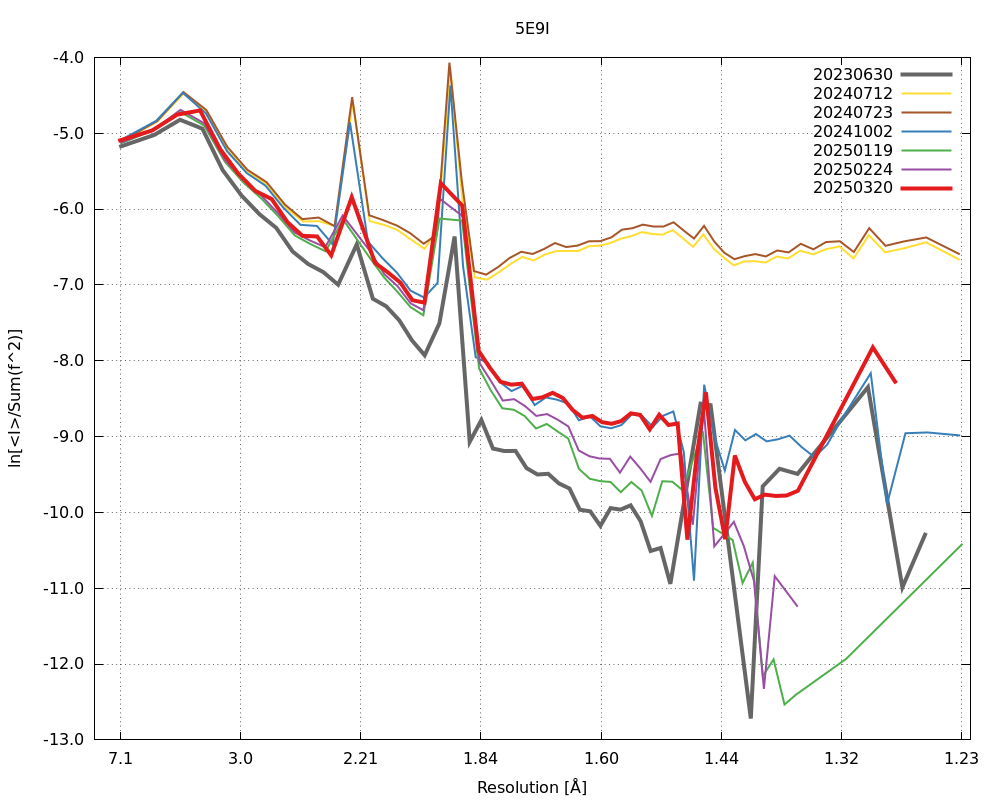 |
| 5FBO | 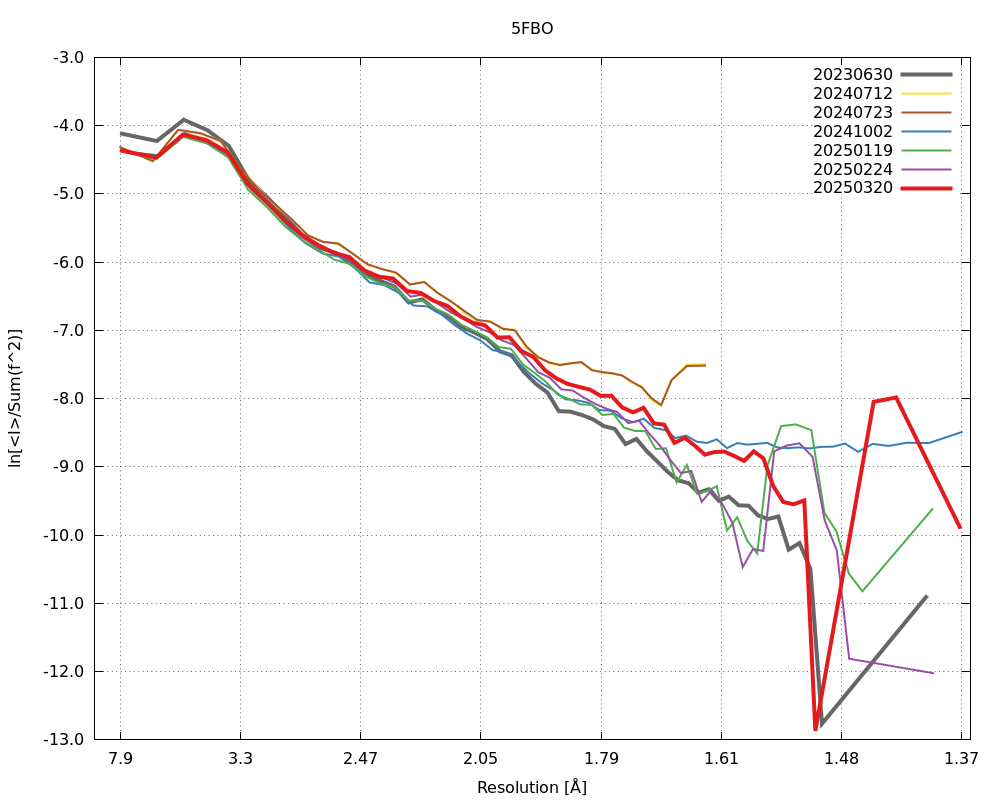 |
| 5OD9 | 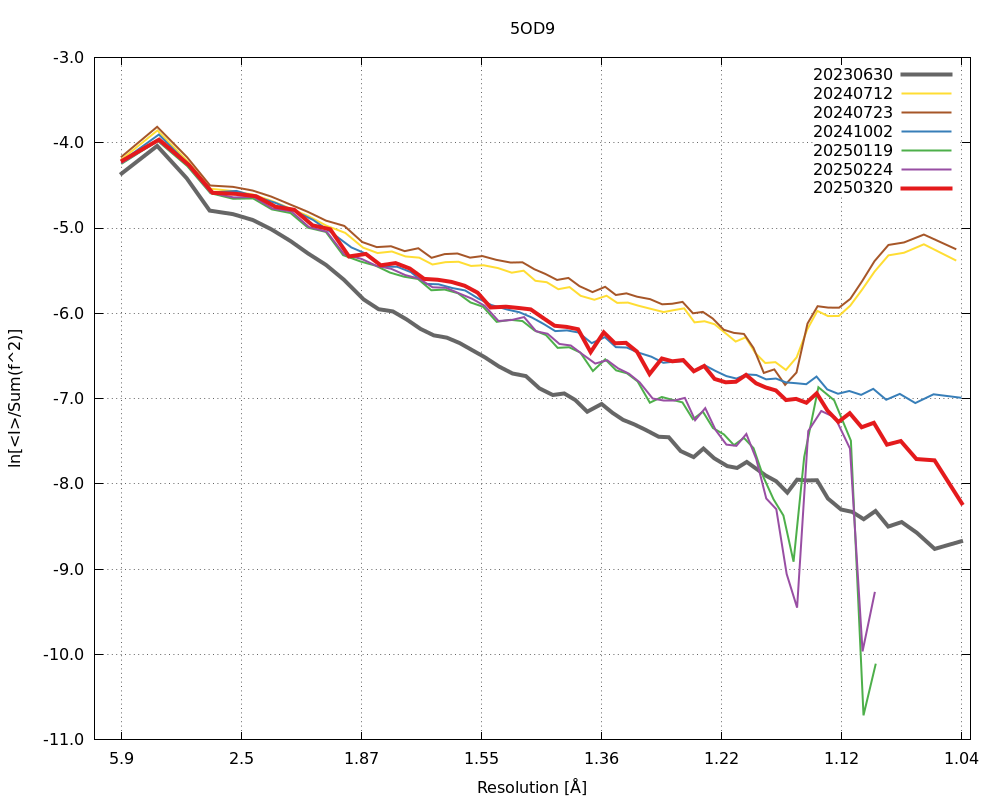 |
| 5ONZ | 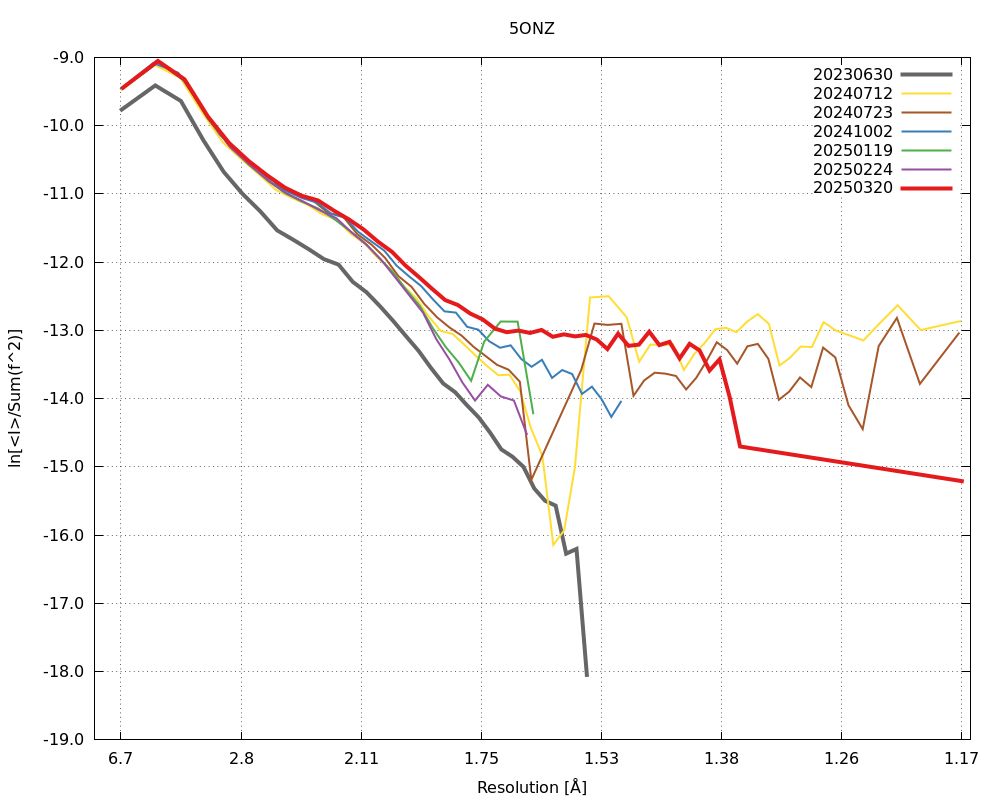 |
| 5RG0 | 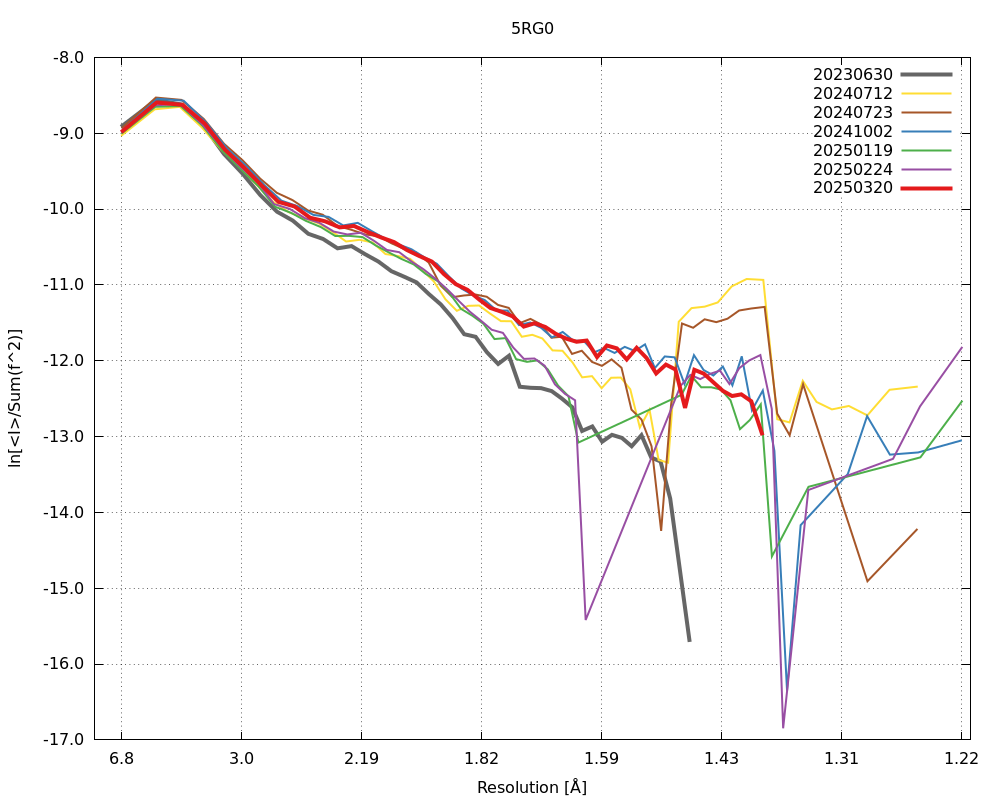 |
| 5SP6 | 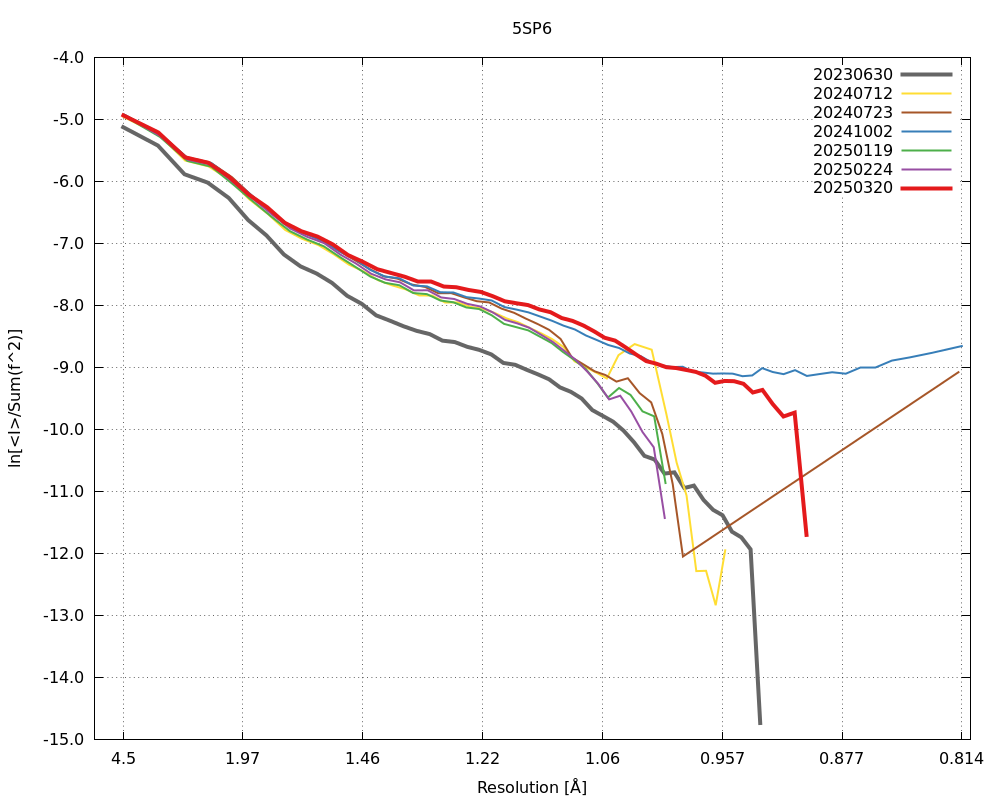 |
| 5VZR | 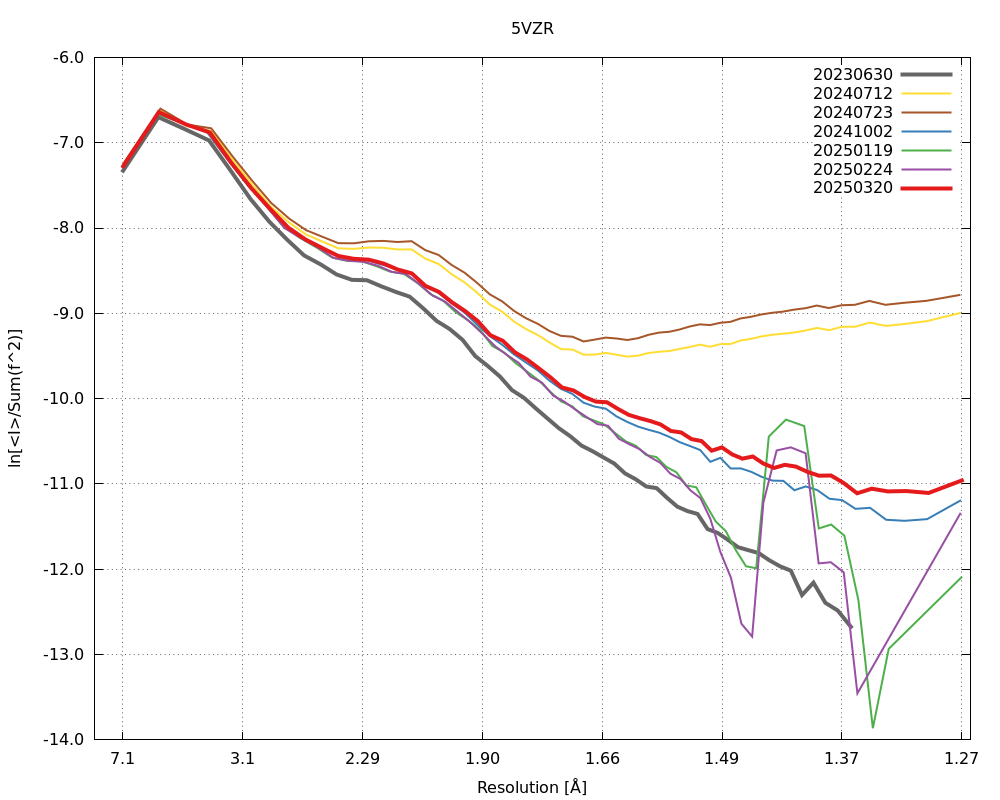 |
| 6BLI | 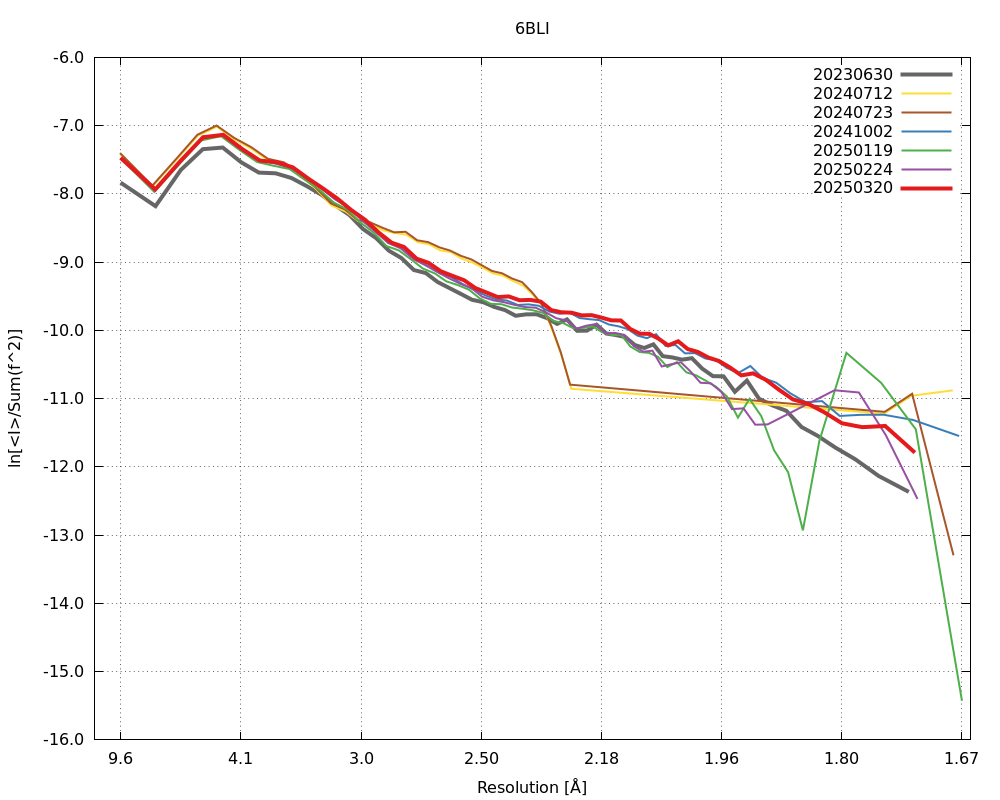 |
| 6CK7 | 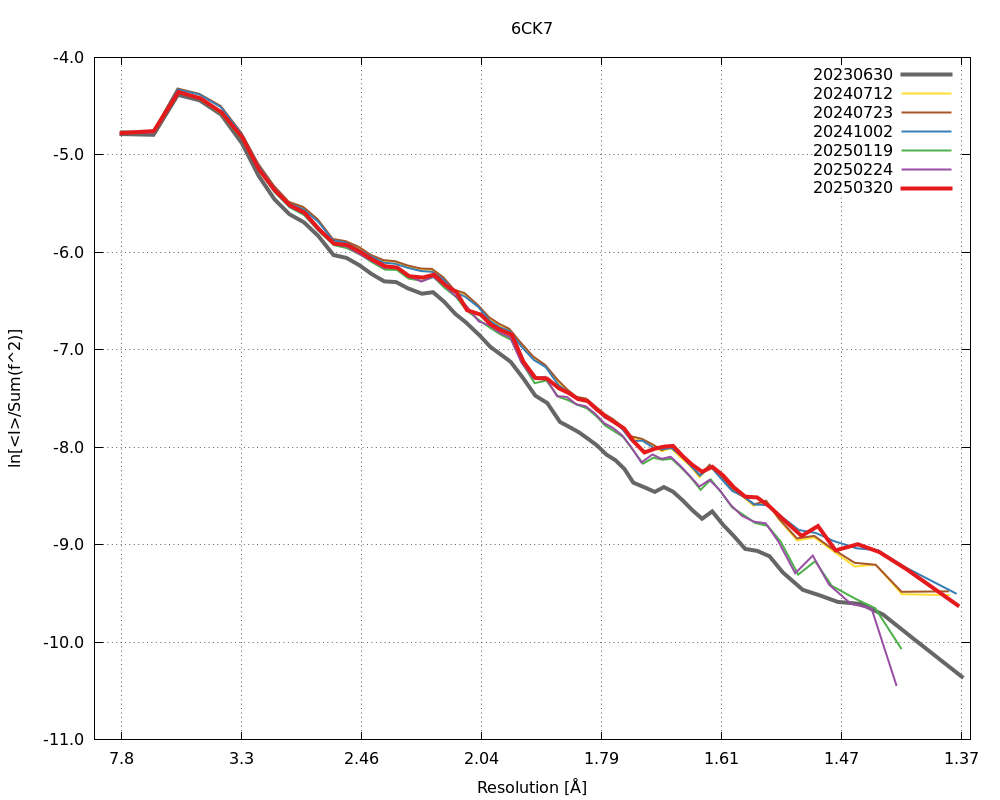 |
| 6CW0 | 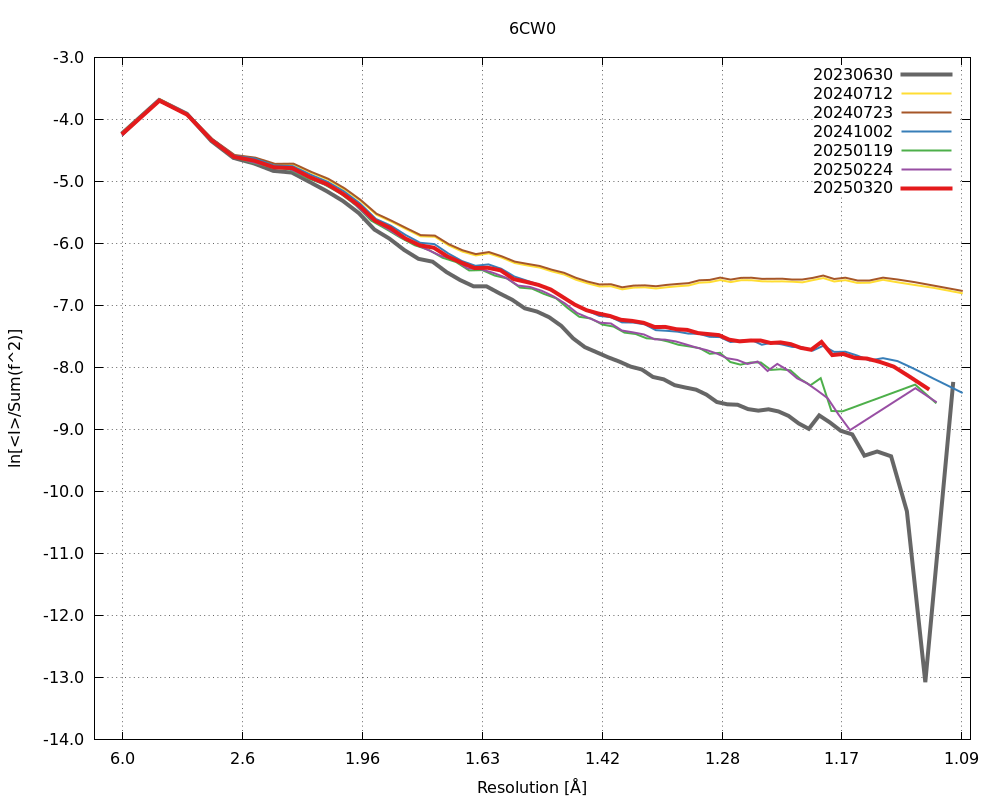 |
| 6DEX | 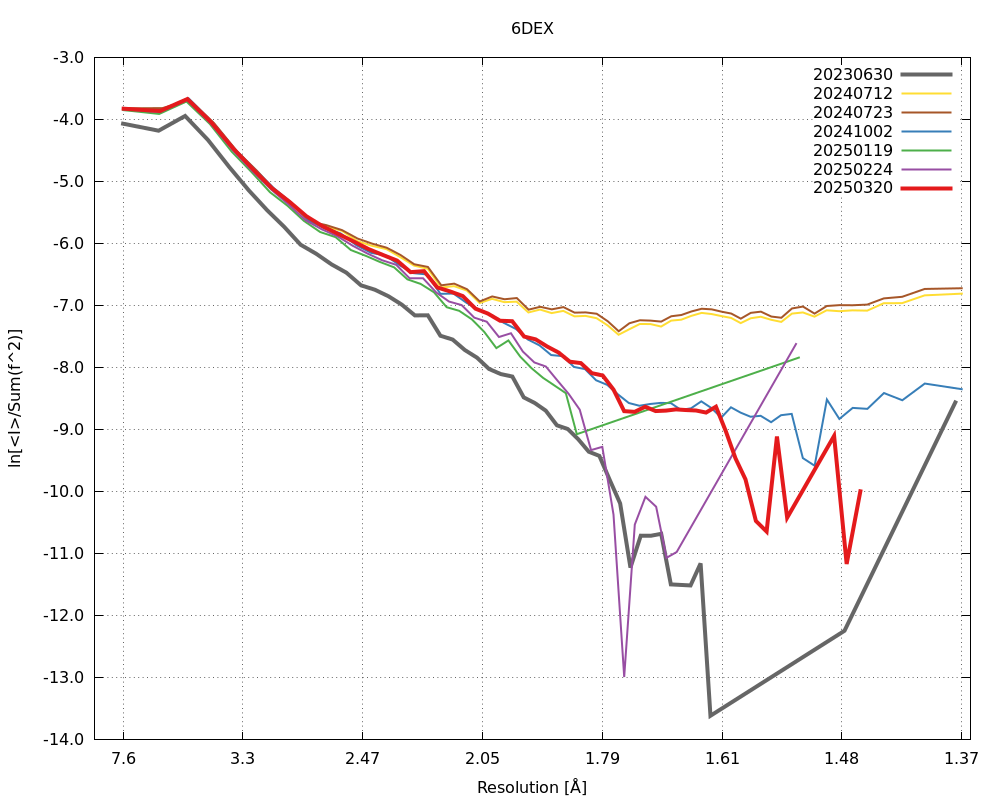 |
| 6NQY | 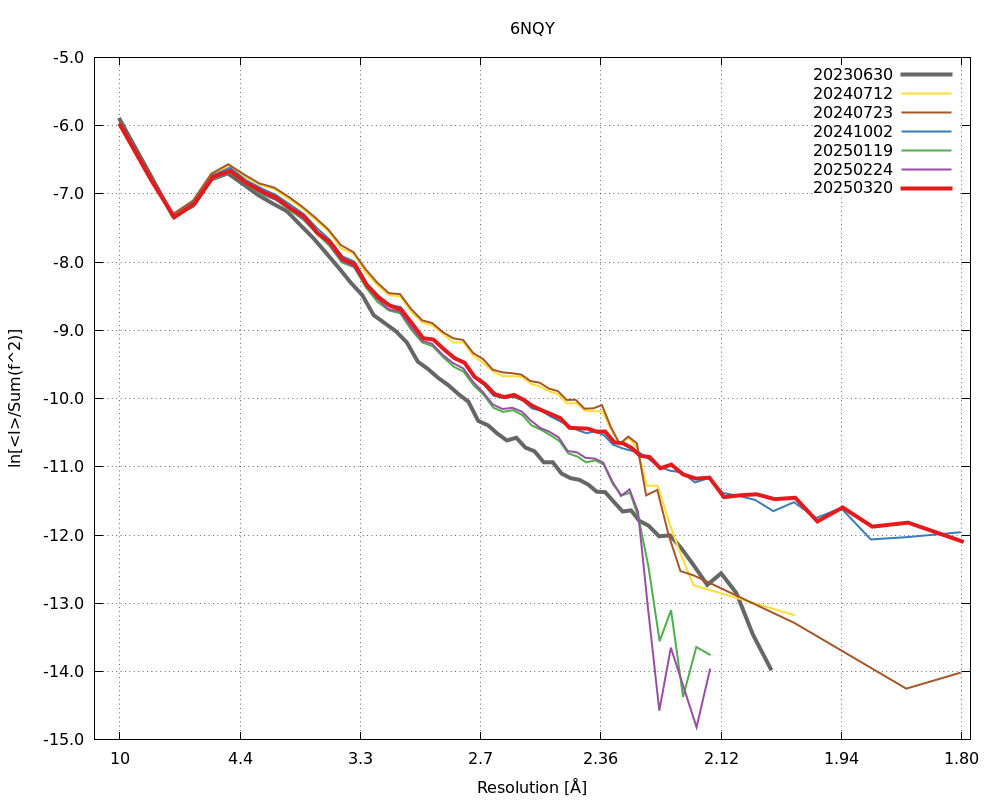 |
| 6P8P | 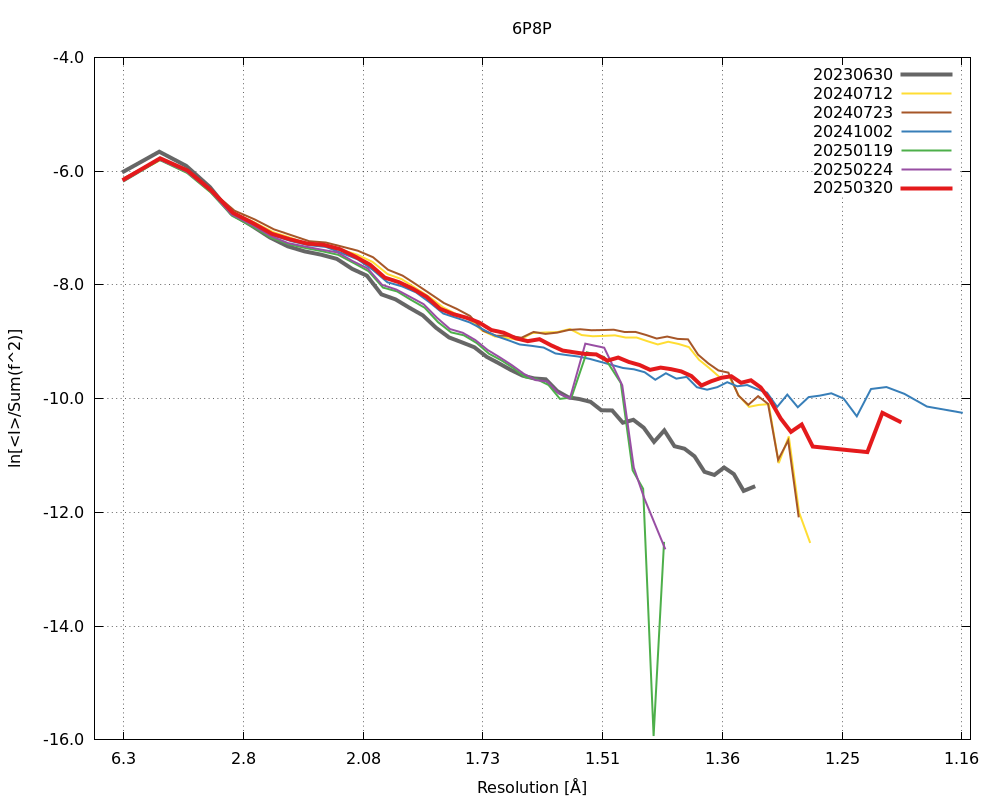 |
| 6P8U | 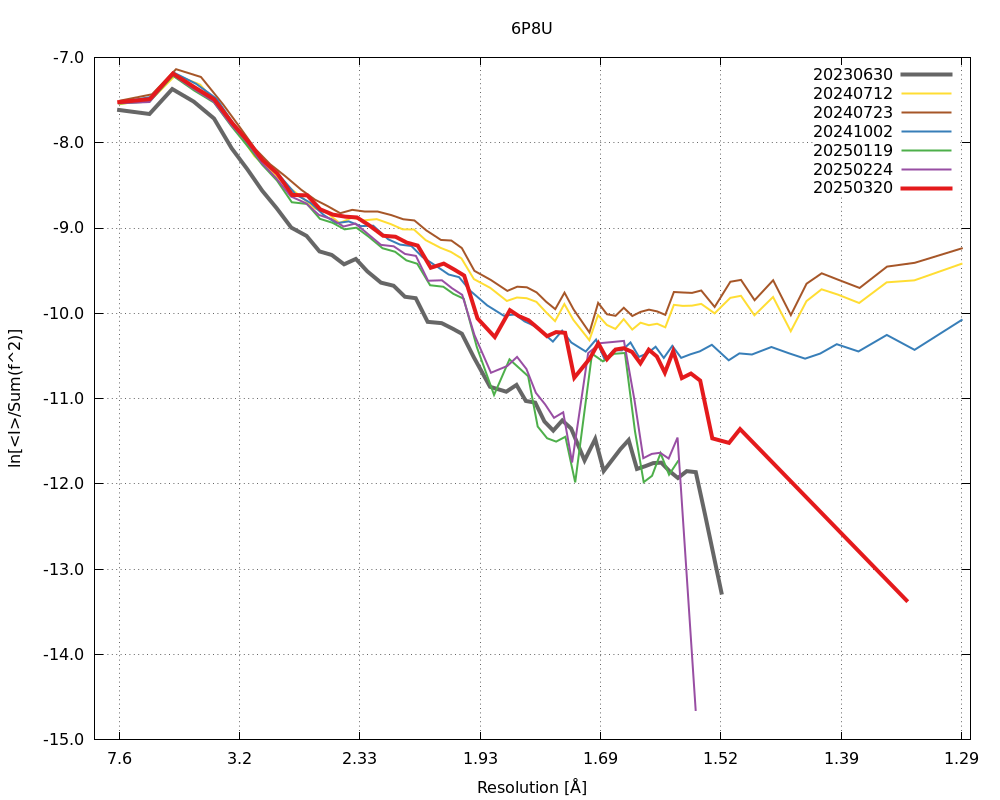 |
| 6R16 | 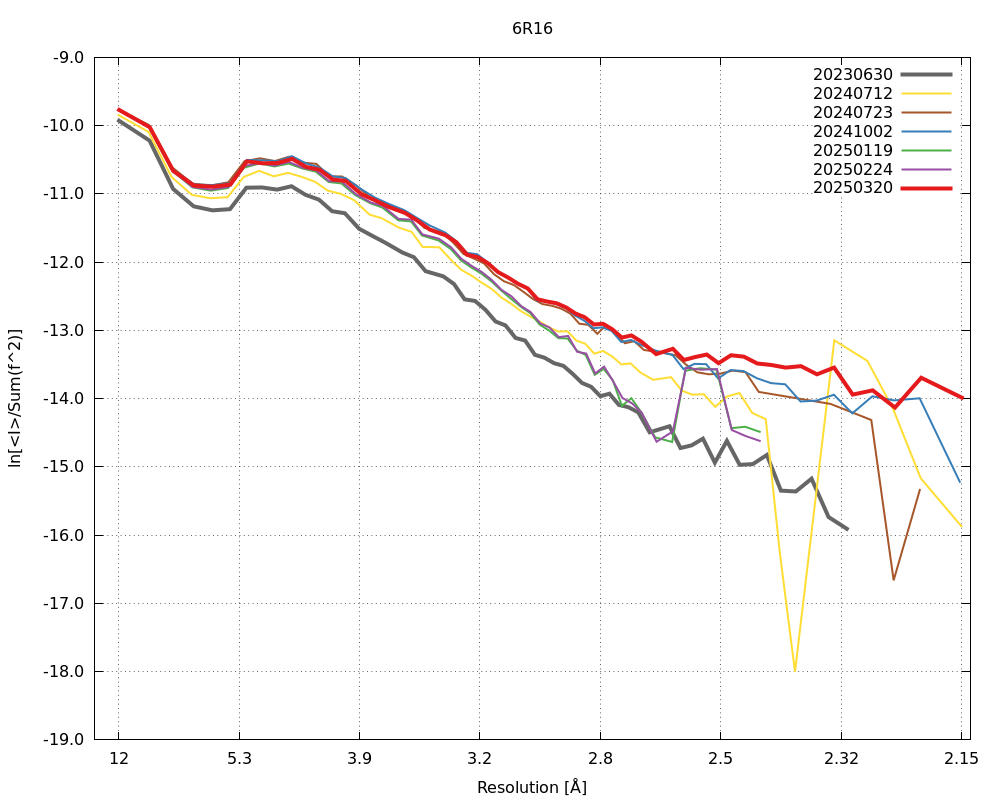 |
| 6TPI | 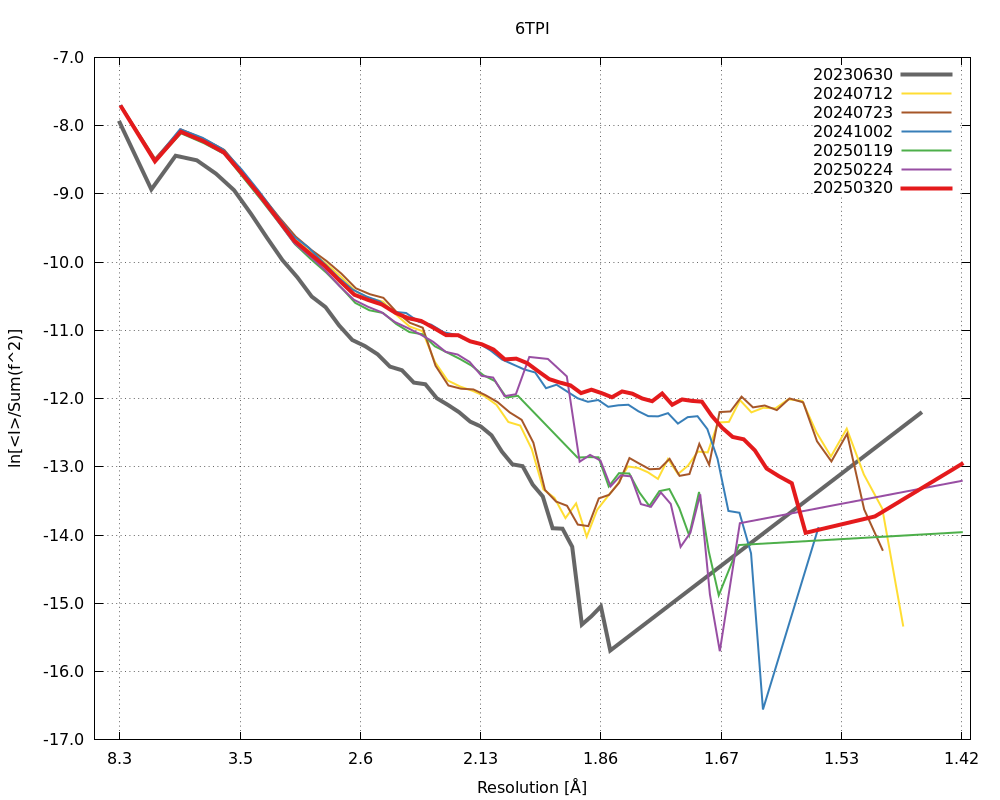 |
| 6UCA | 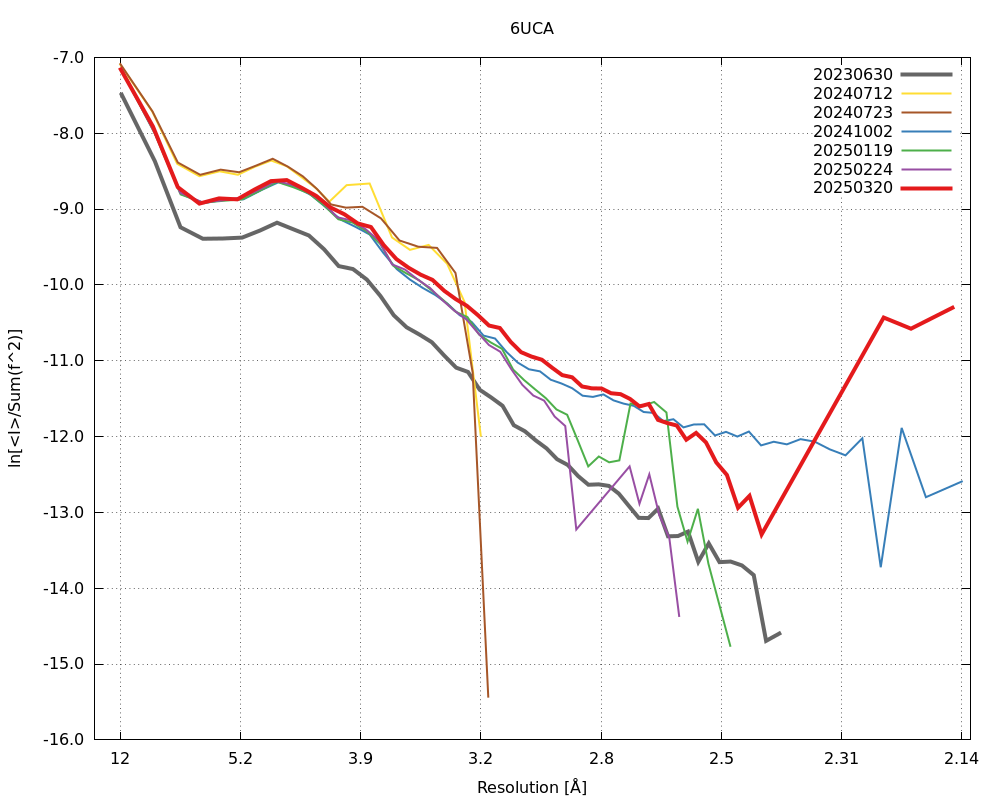 |
| 6VZQ | 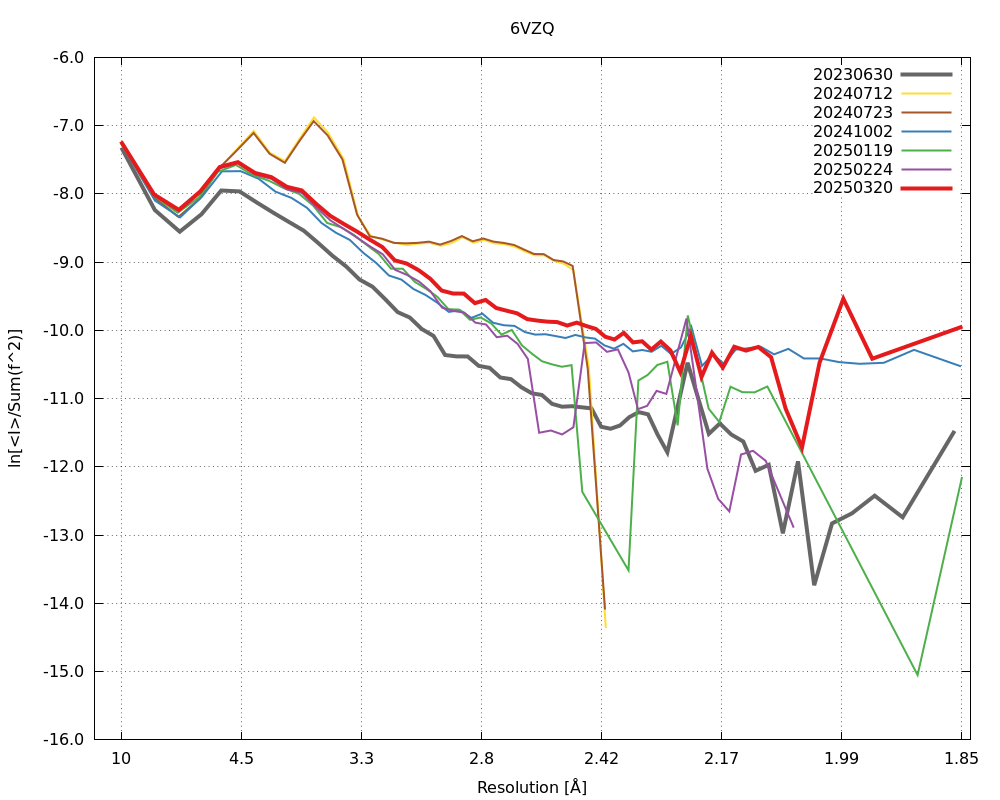 |
| 6VZW | 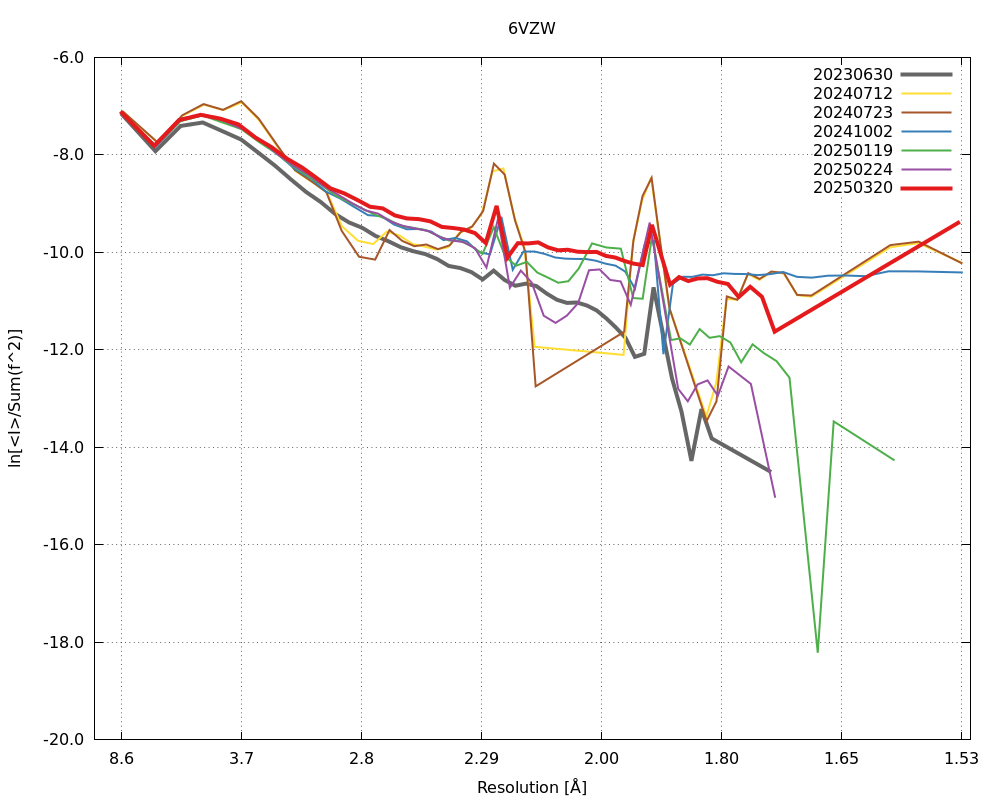 |
| 7AO5 | 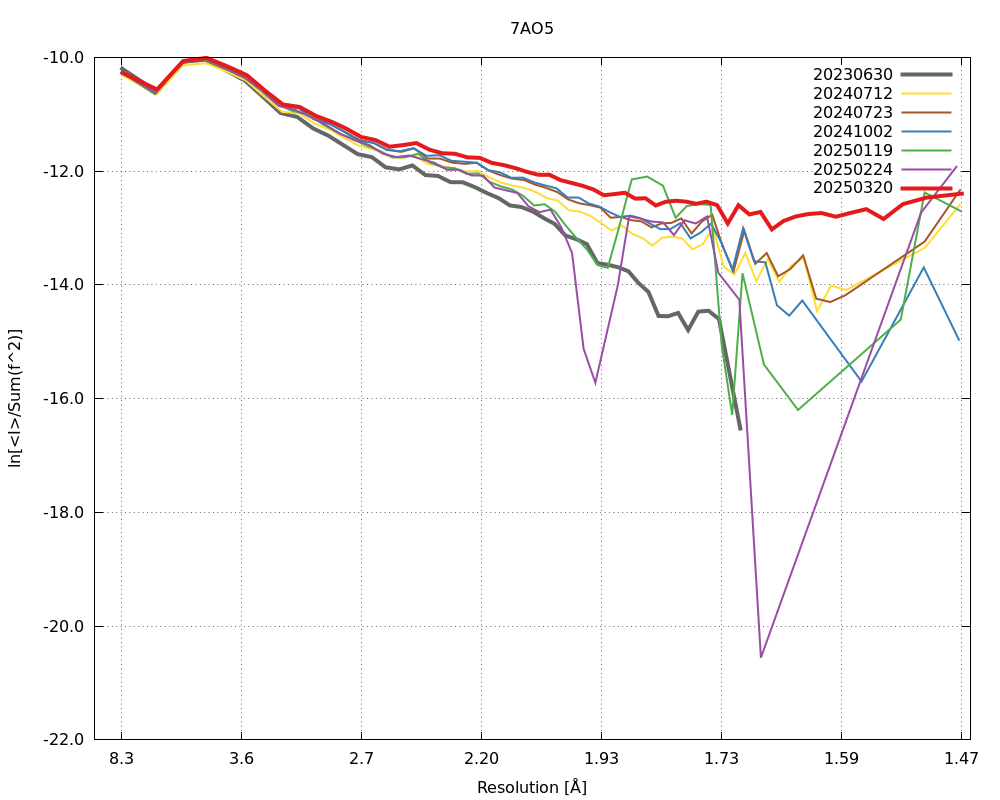 |
| 7DK1 | 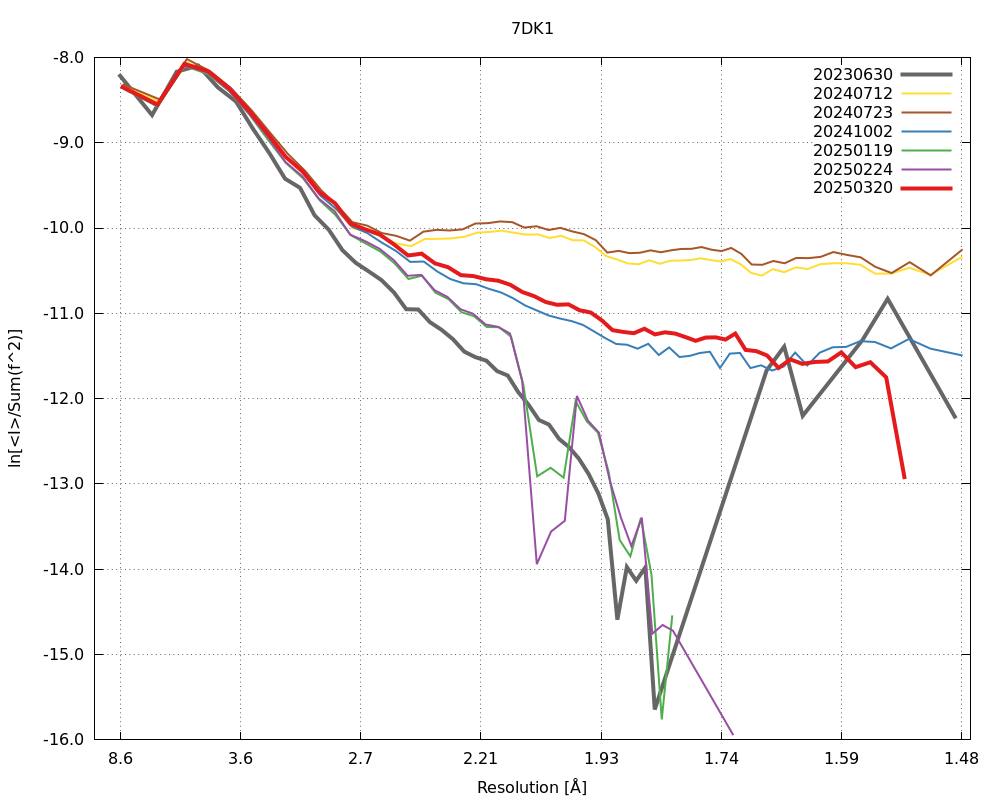 |
| 7KDS | 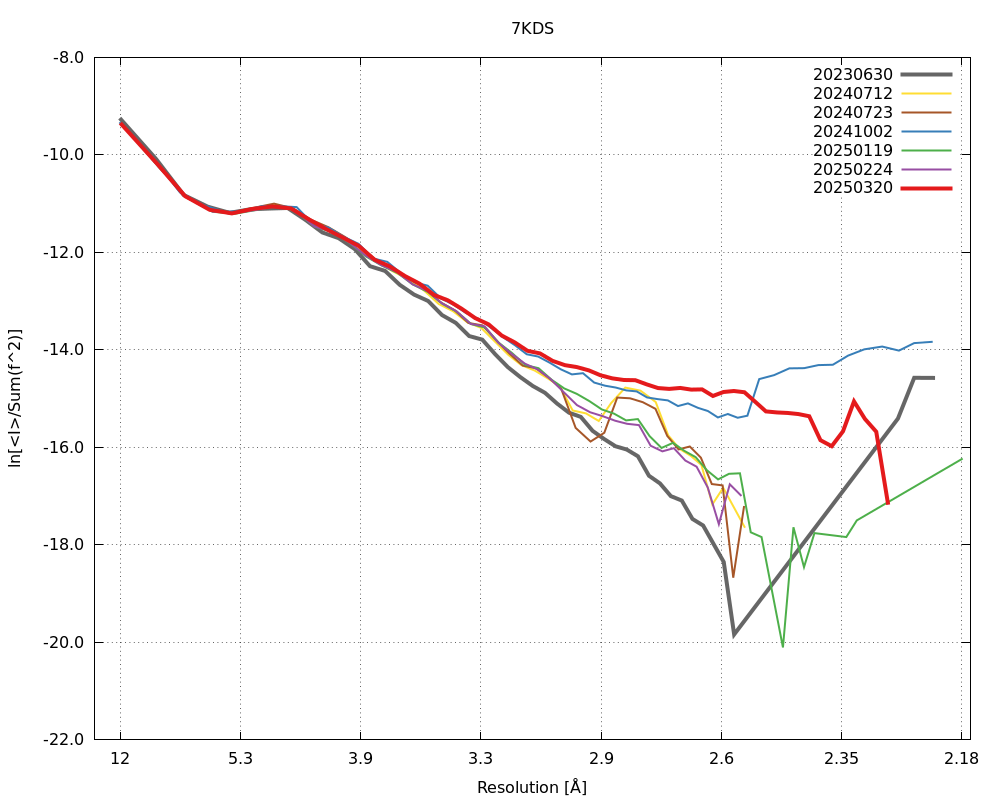 |
| 7MJB | 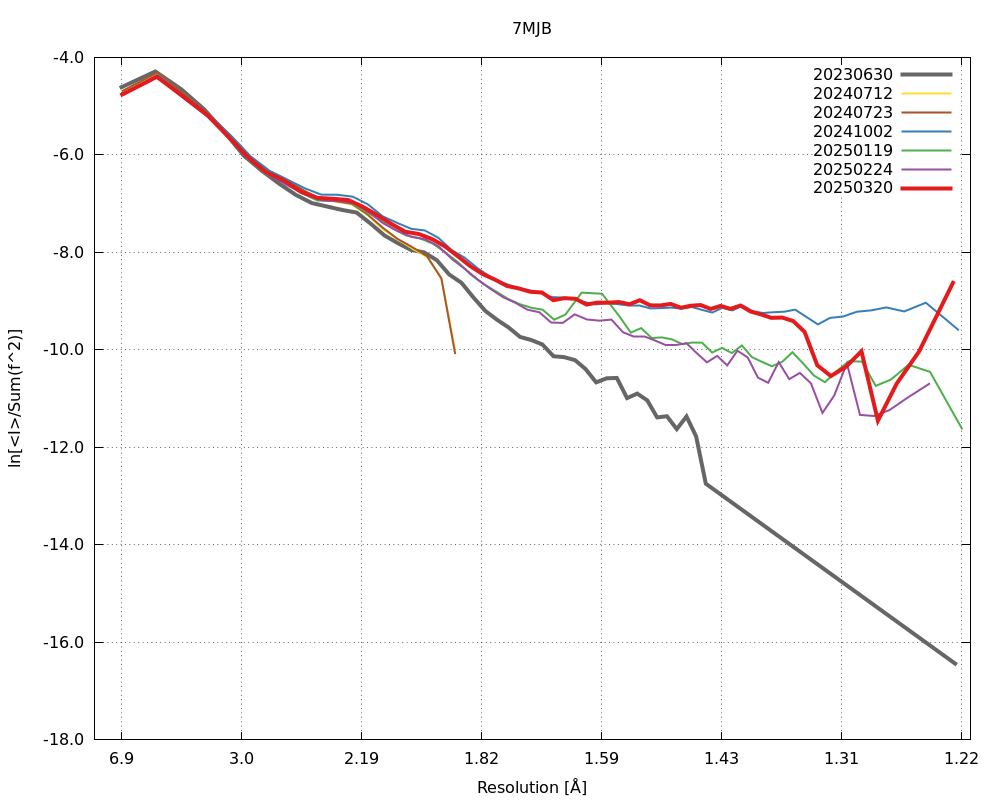 |
| 7S87 | 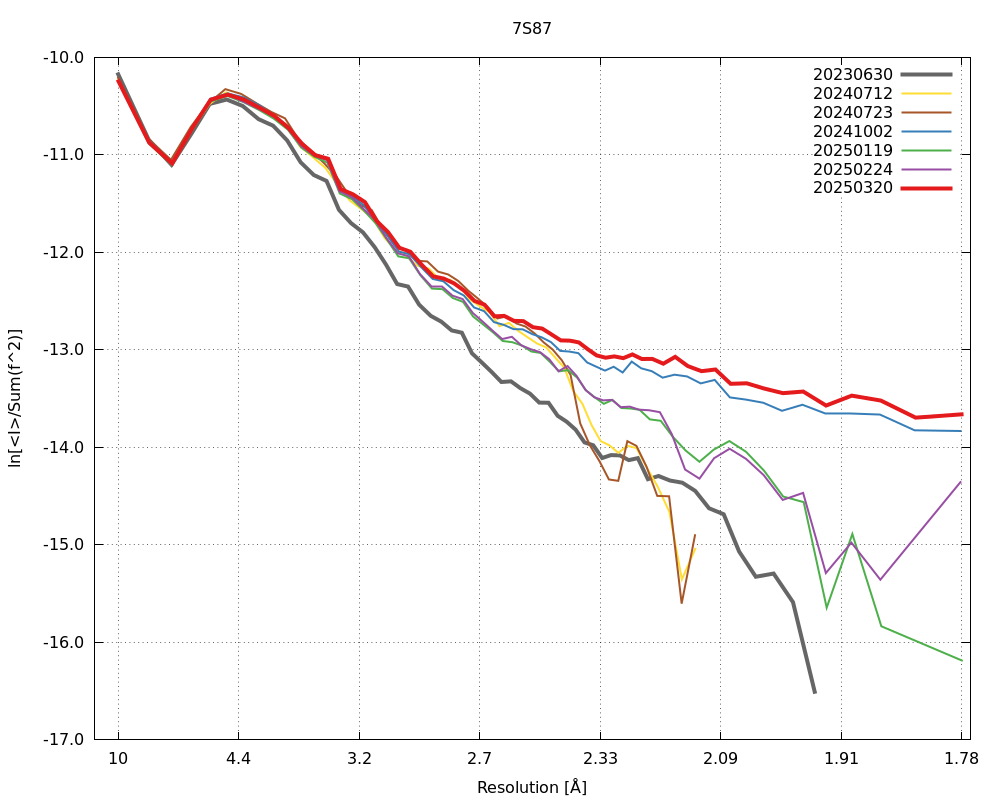 |
| 7SY9 | 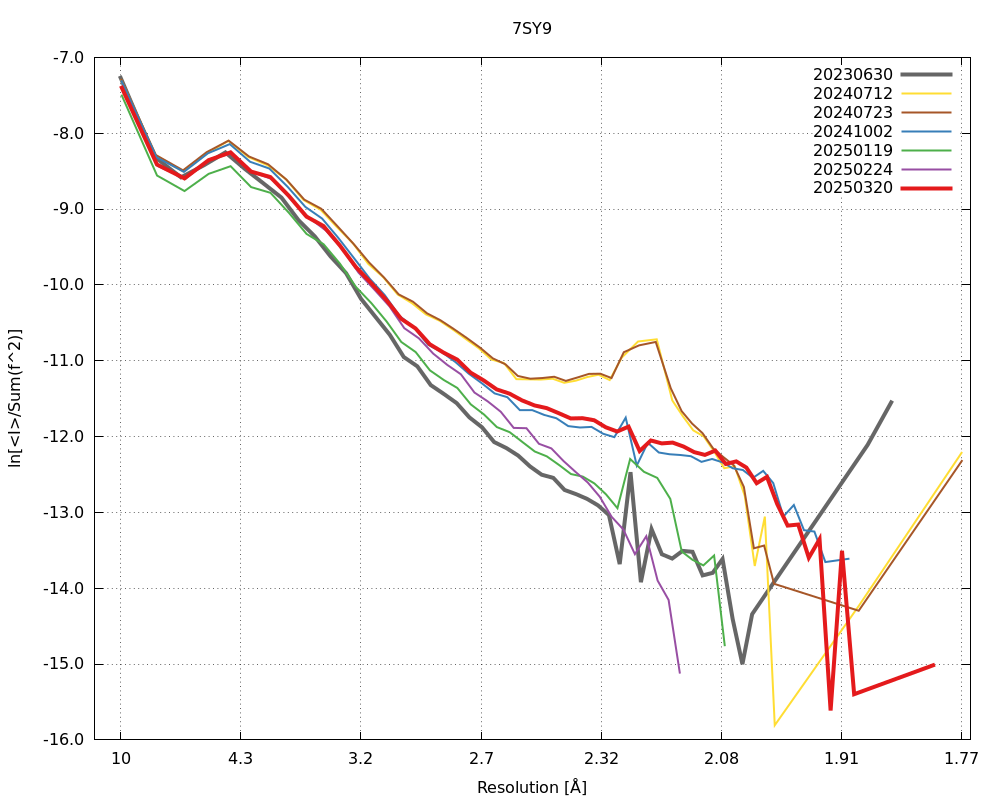 |
| 7TM9 | 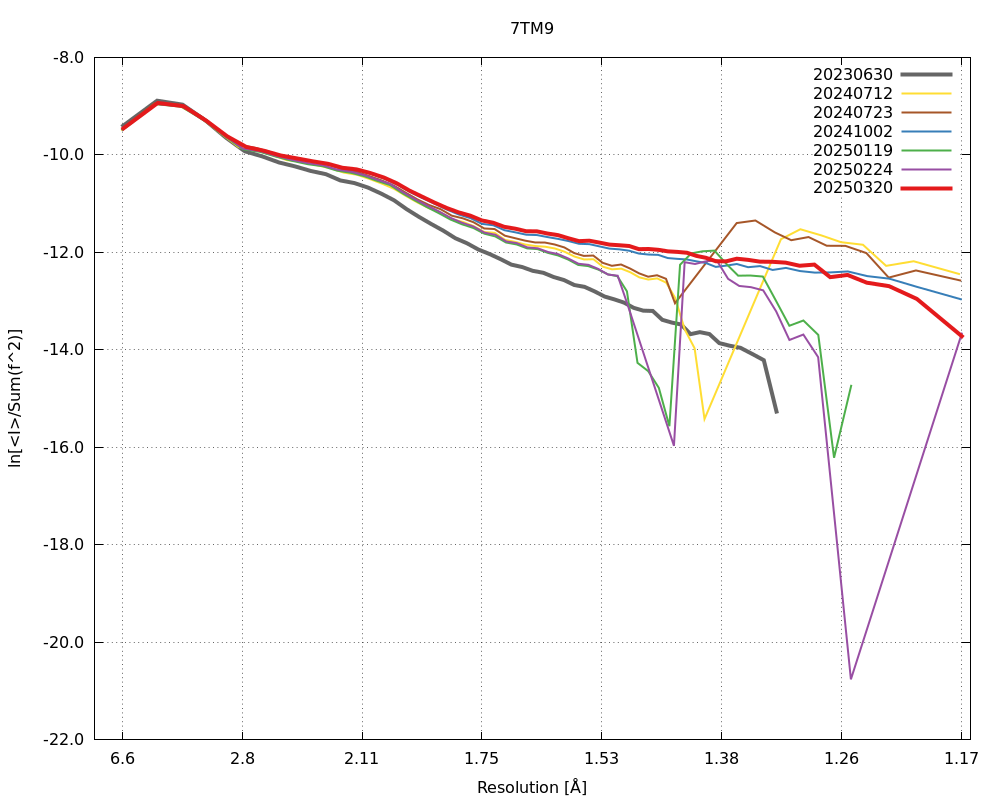 |
| 7UV5 | 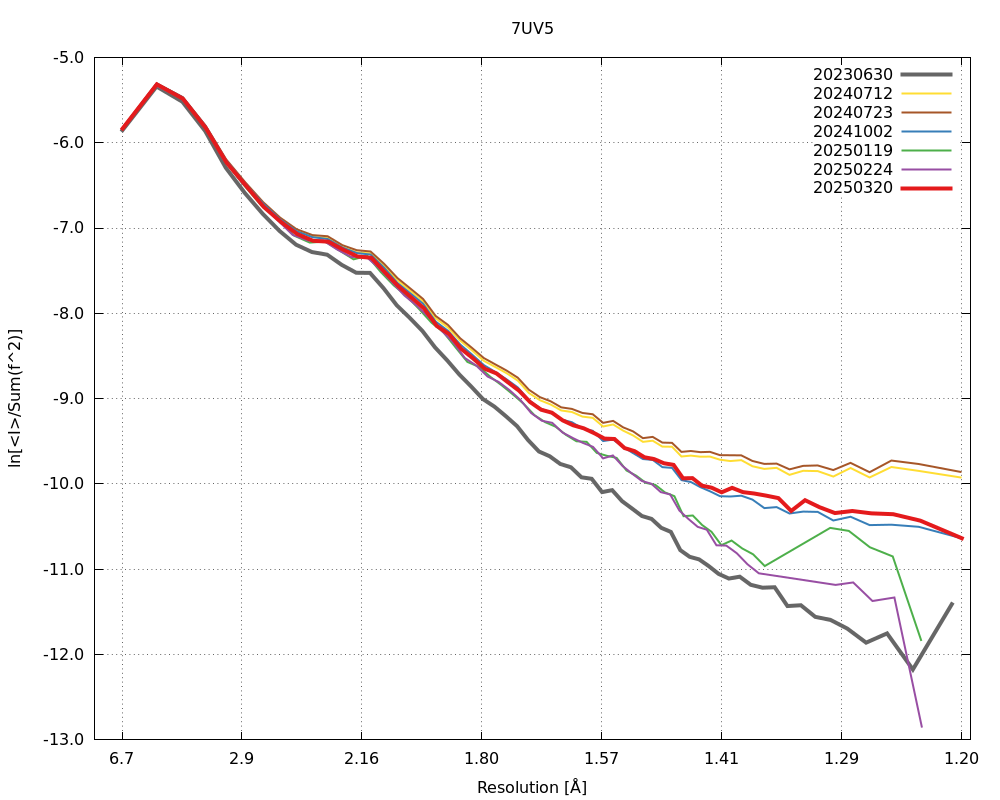 |
| 7WDA | 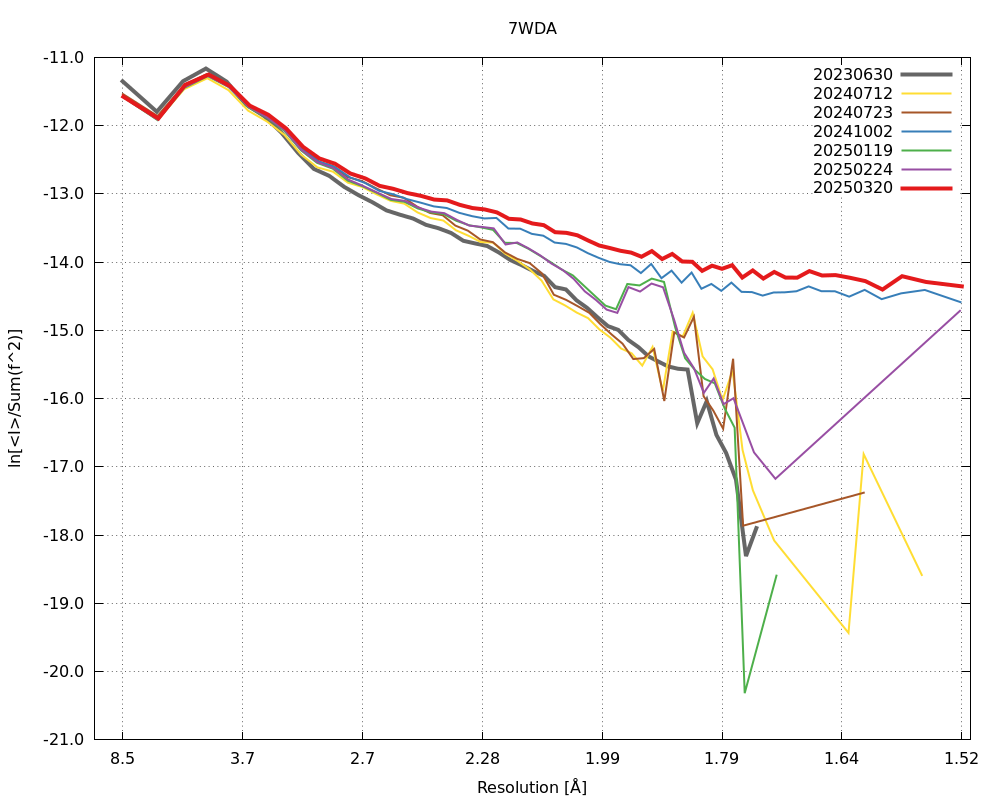 |
| 7Z1V | 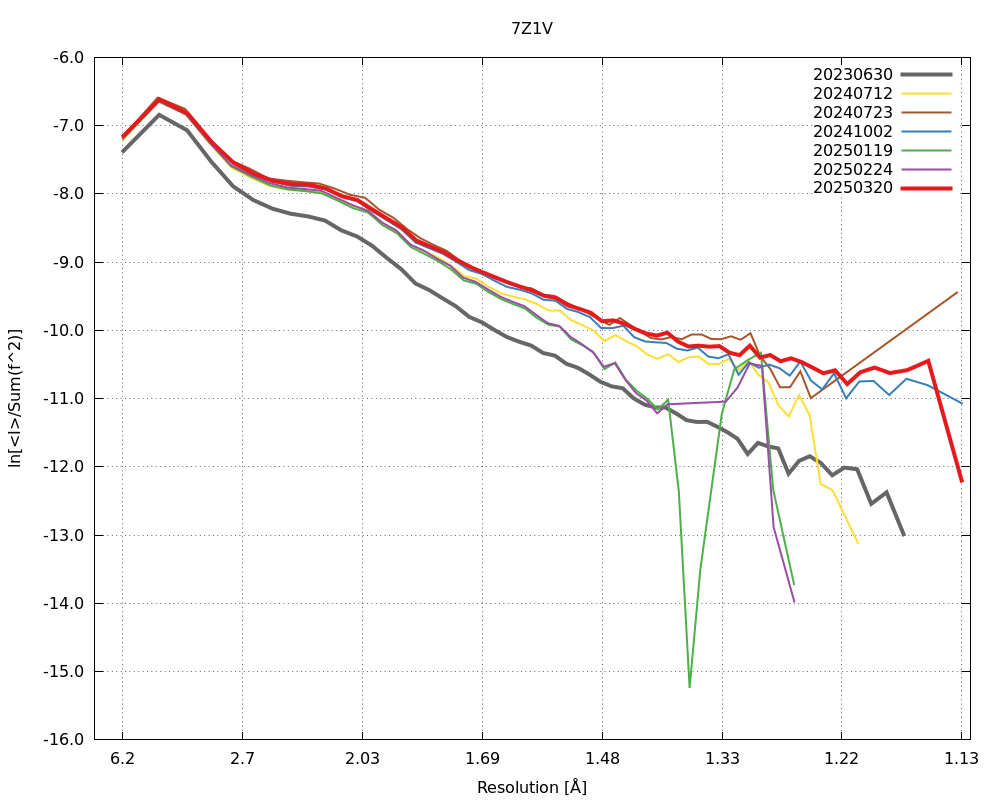 |
| 7Z1Y | 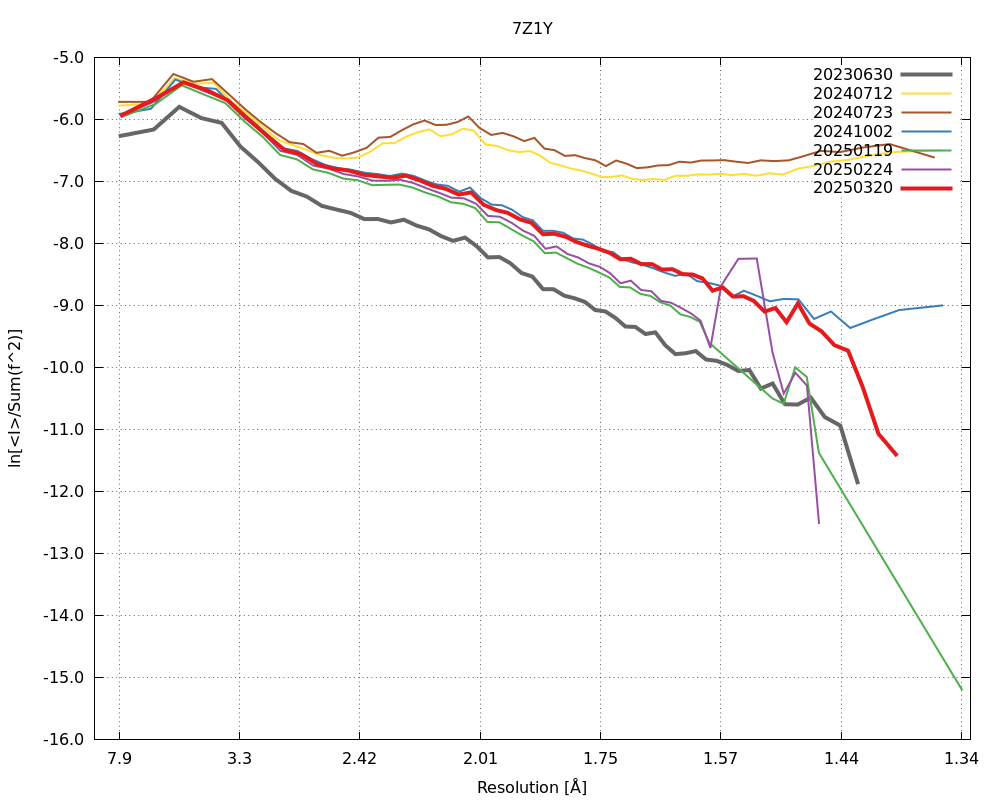 |
| 7Z41 | 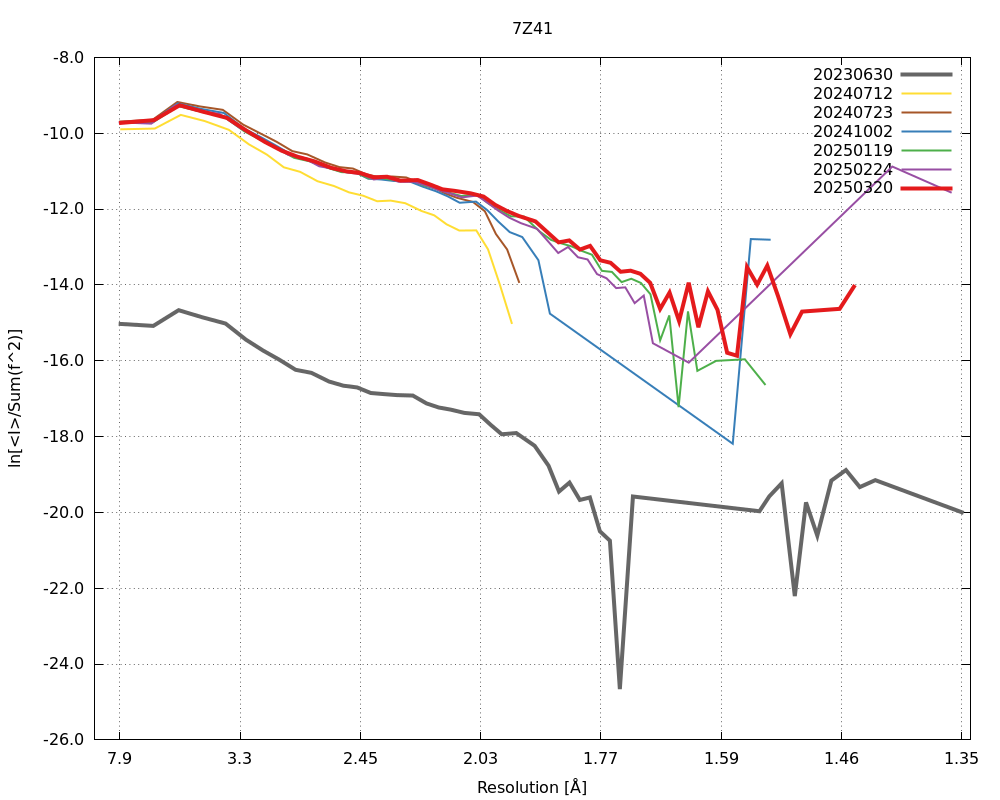 |
| 8AGQ | 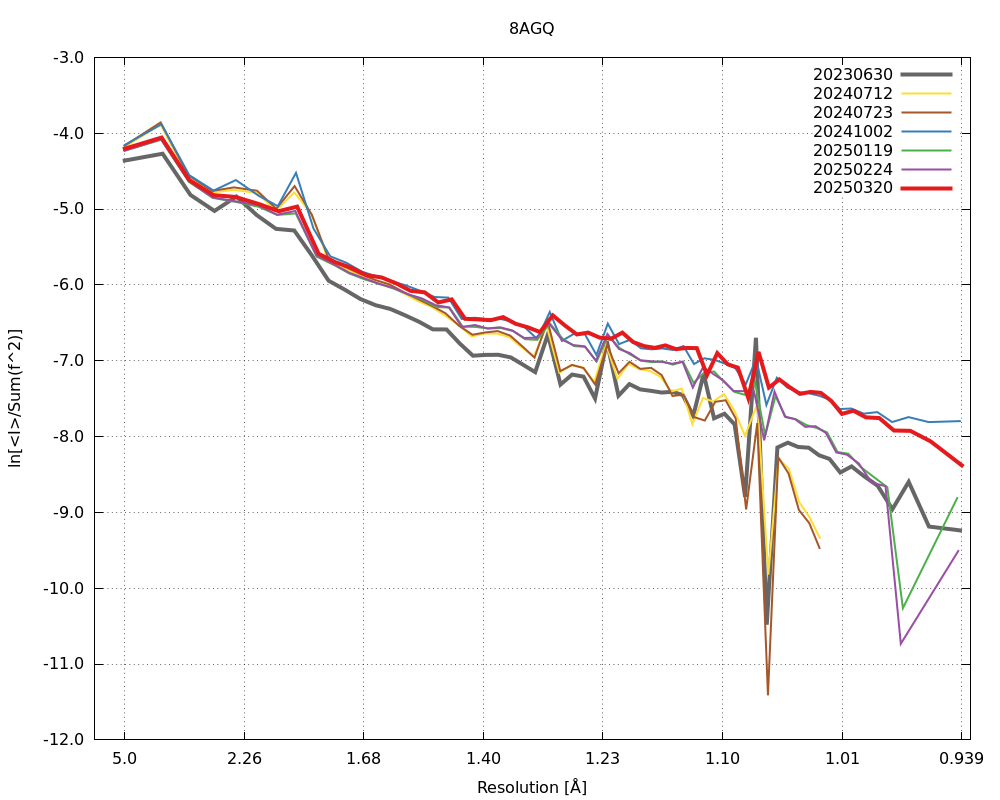 |
| 8B1N | 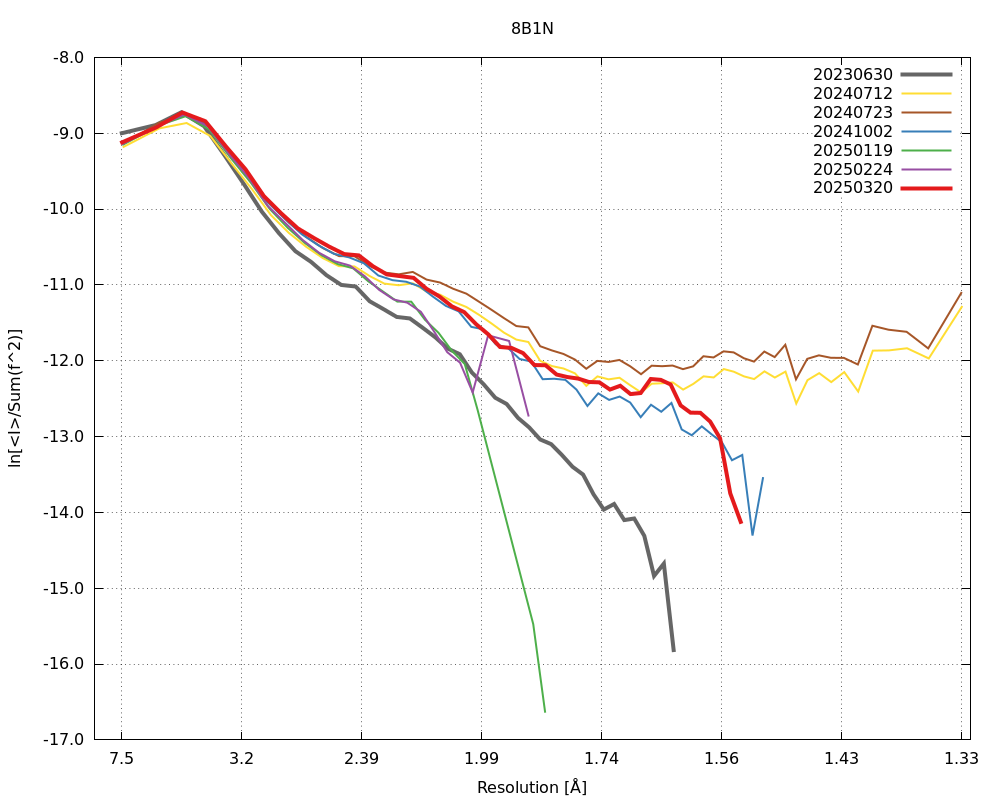 |
| 8BXT | 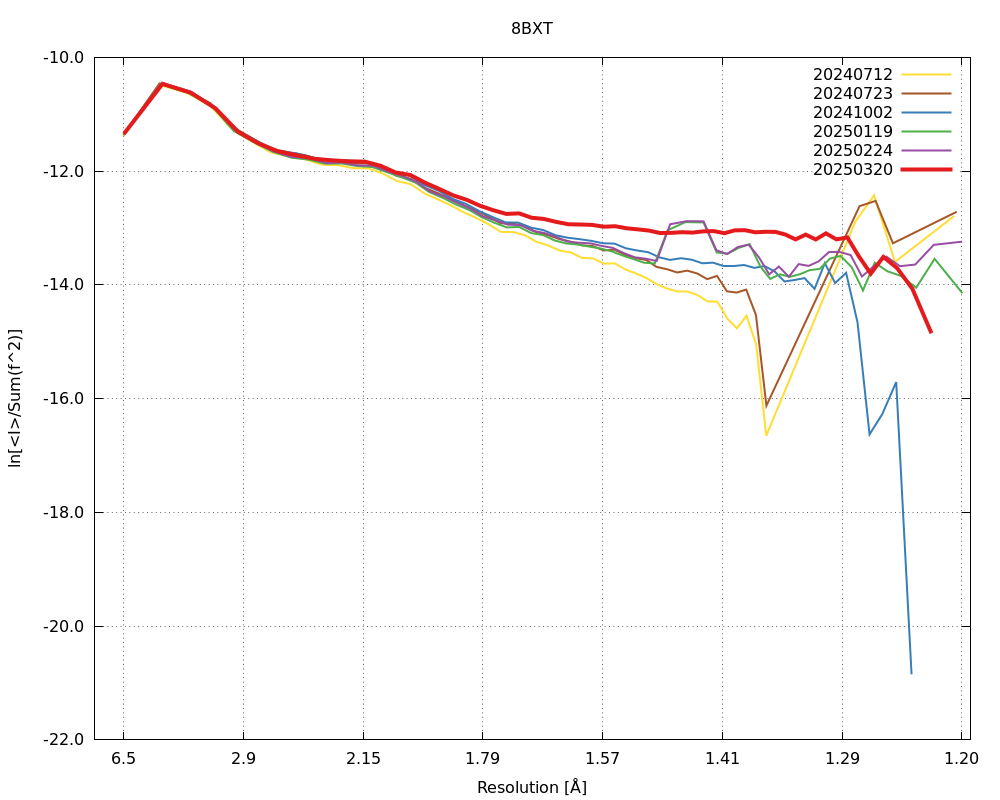 |
| 8DA3 | 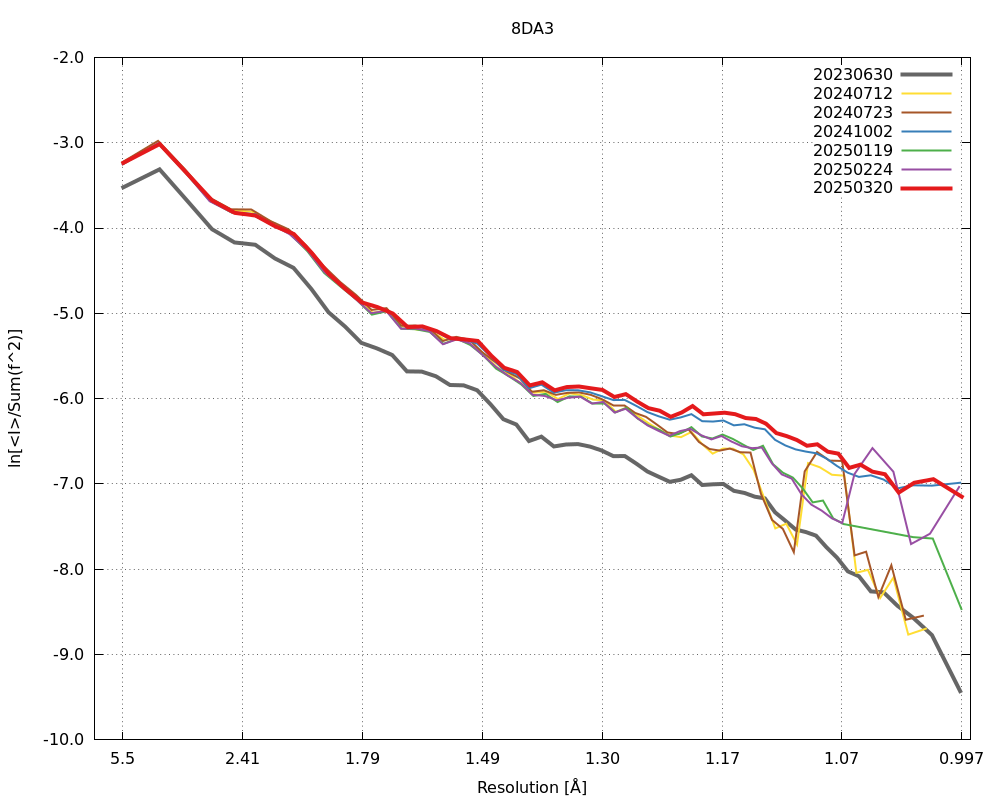 |
| 8EGN | 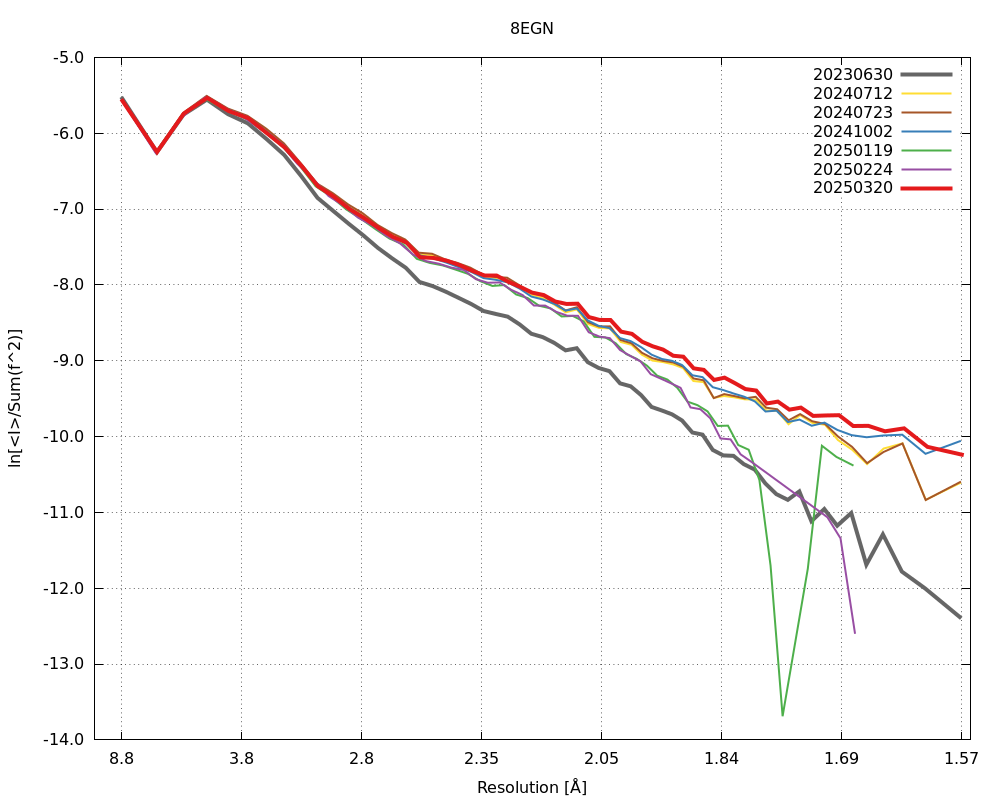 |
| 8EPS | 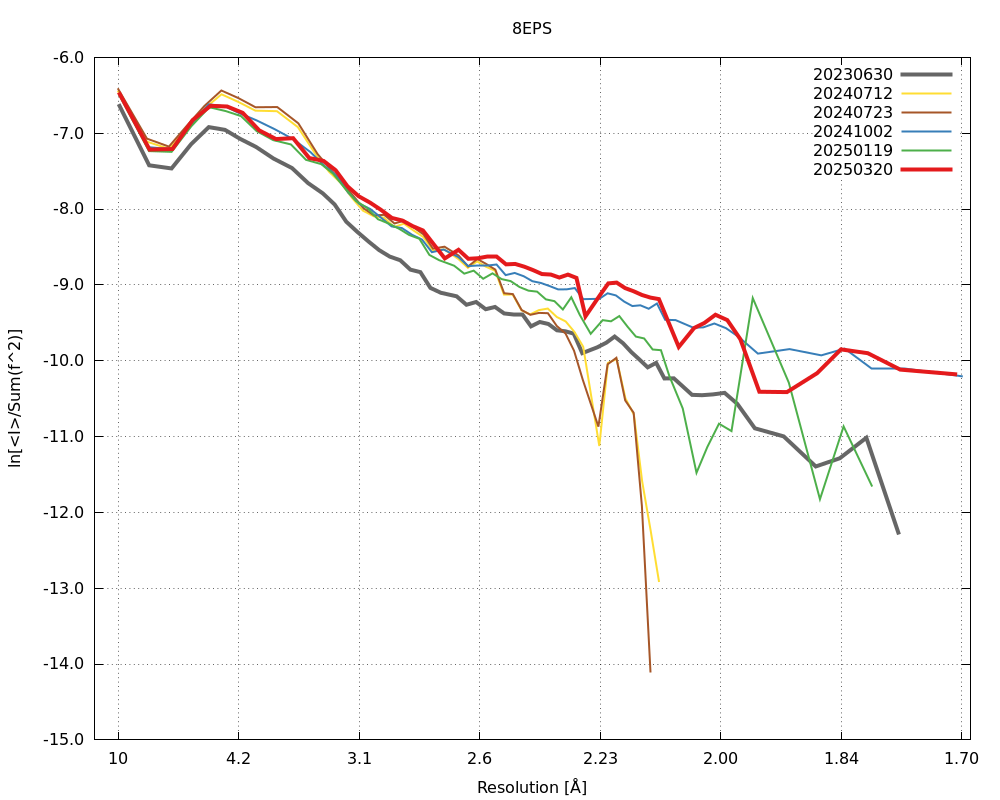 |
| 8EW7 | 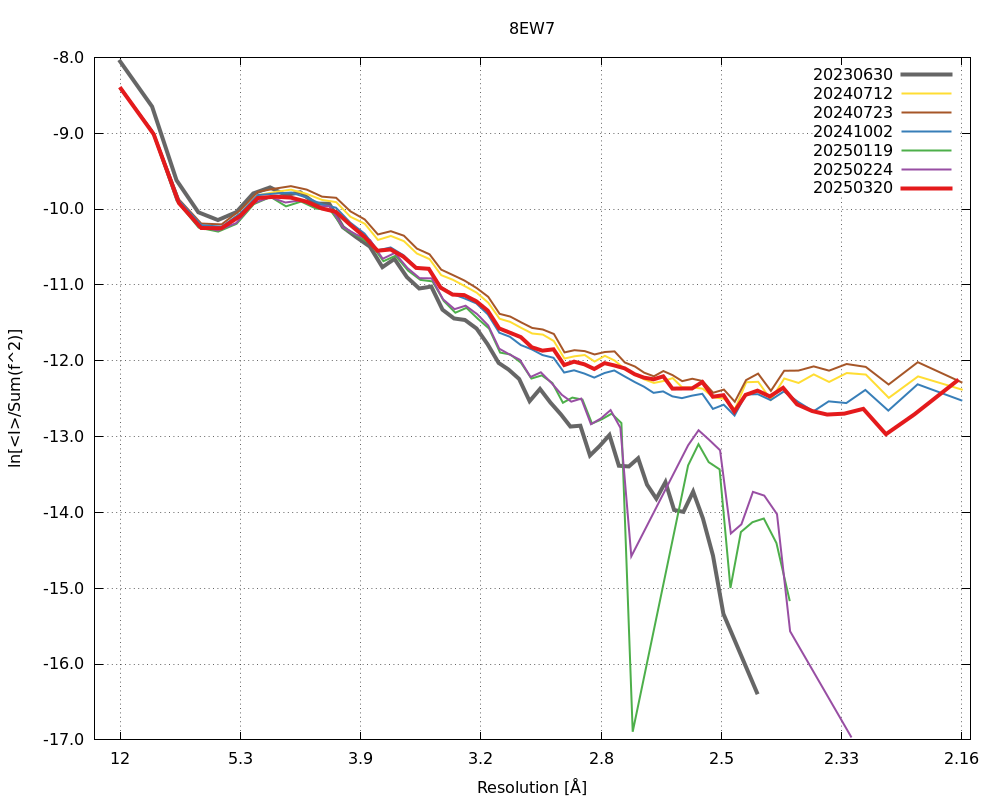 |
| 8FG7 | 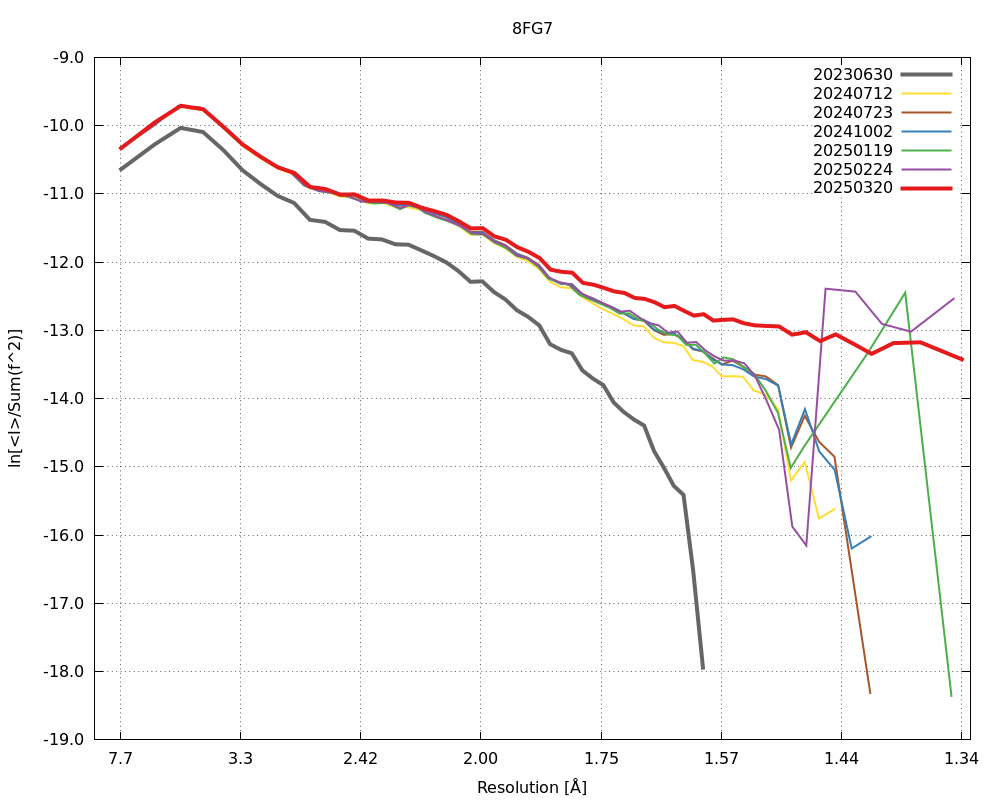 |
| 8FT8 | 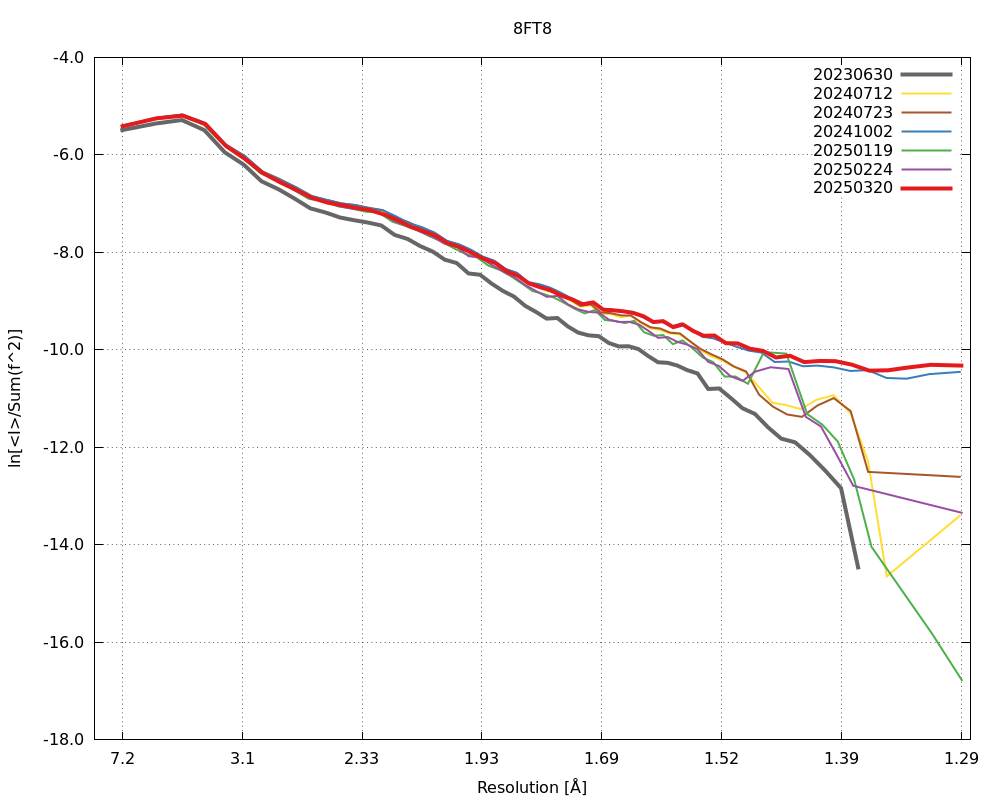 |
| 8GCA | 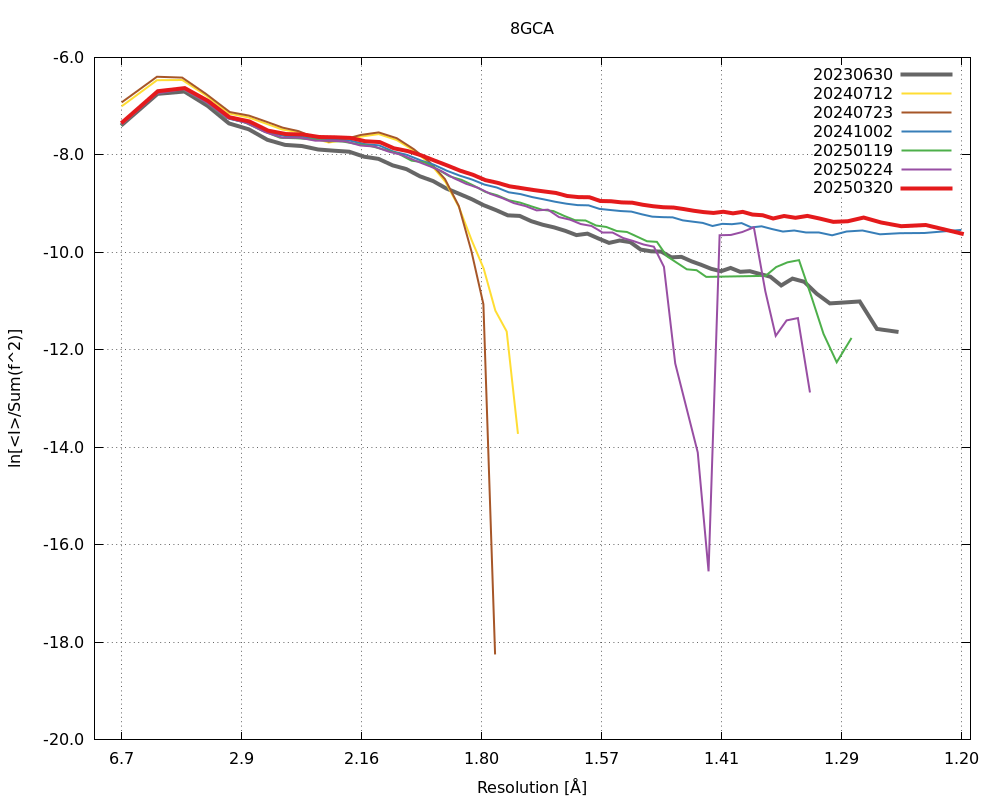 |
| 8K4Q | 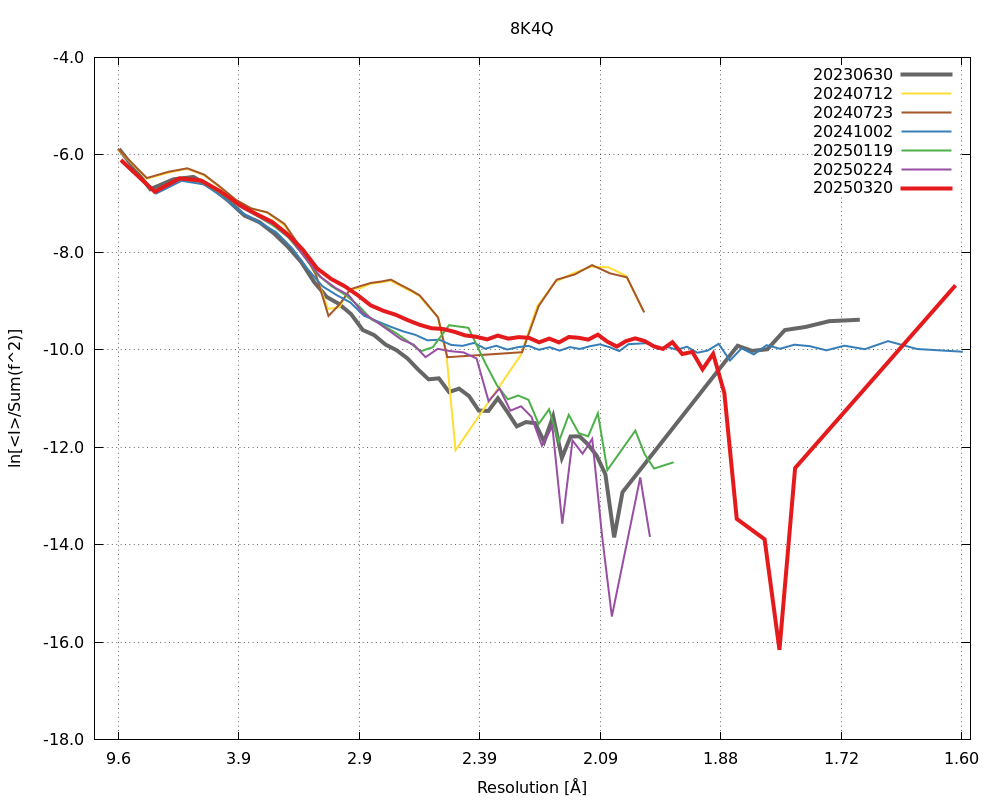 |
| 8PQC | 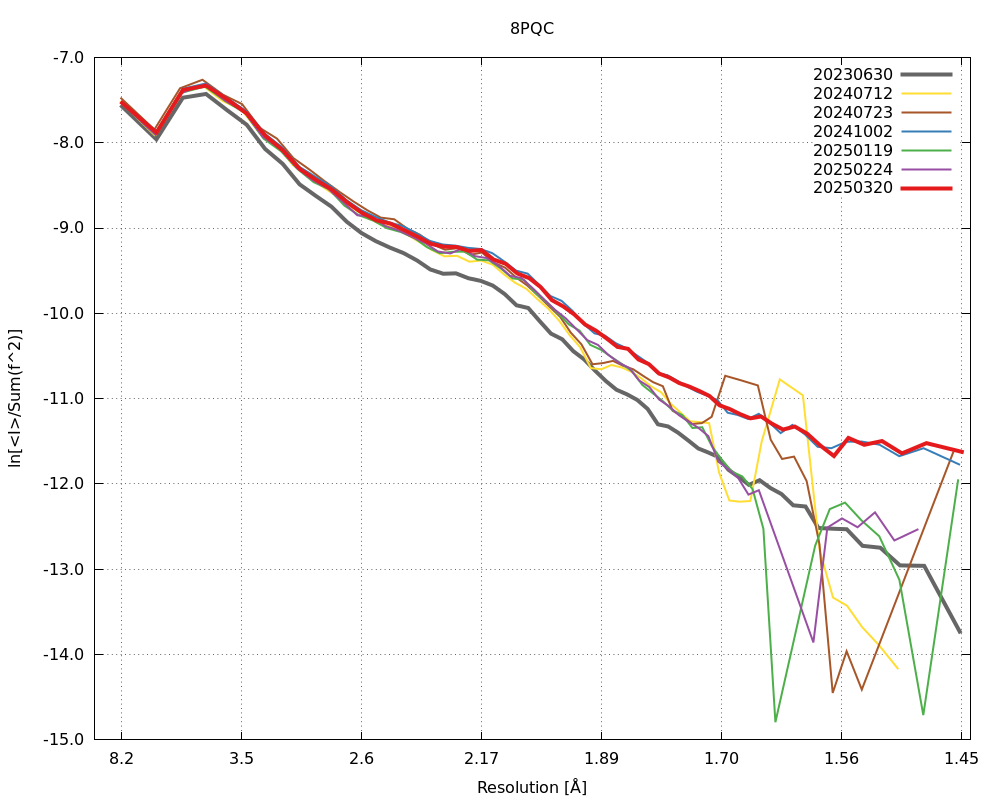 |
| 8R5Q | 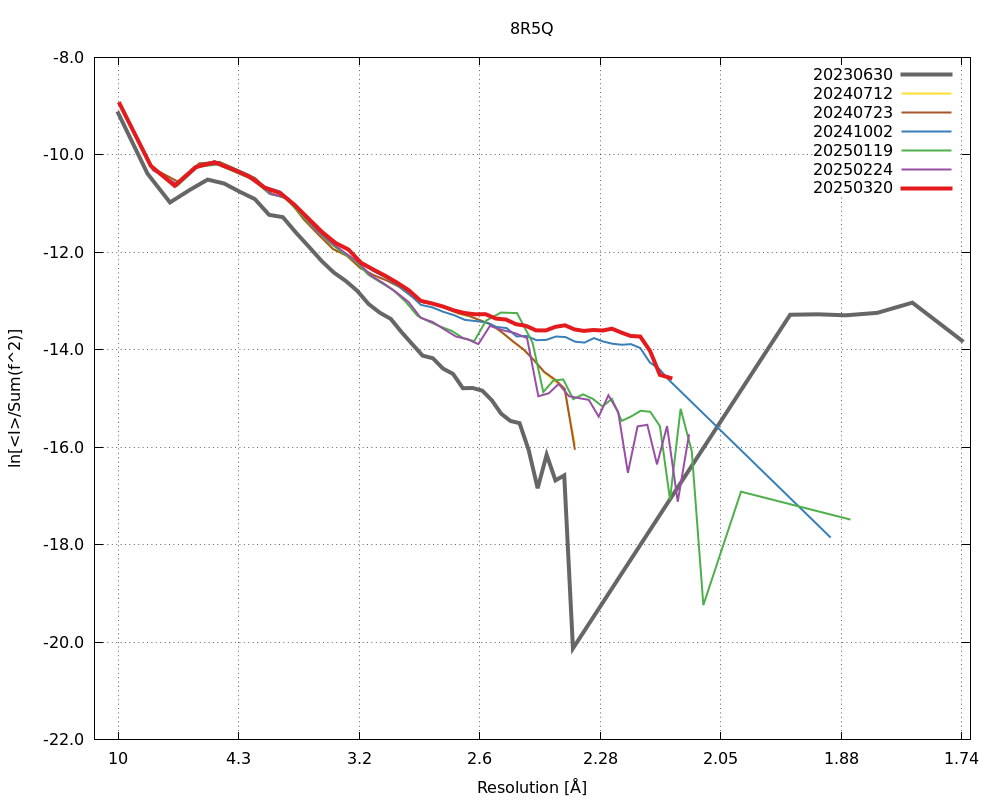 |
| 8RCC | 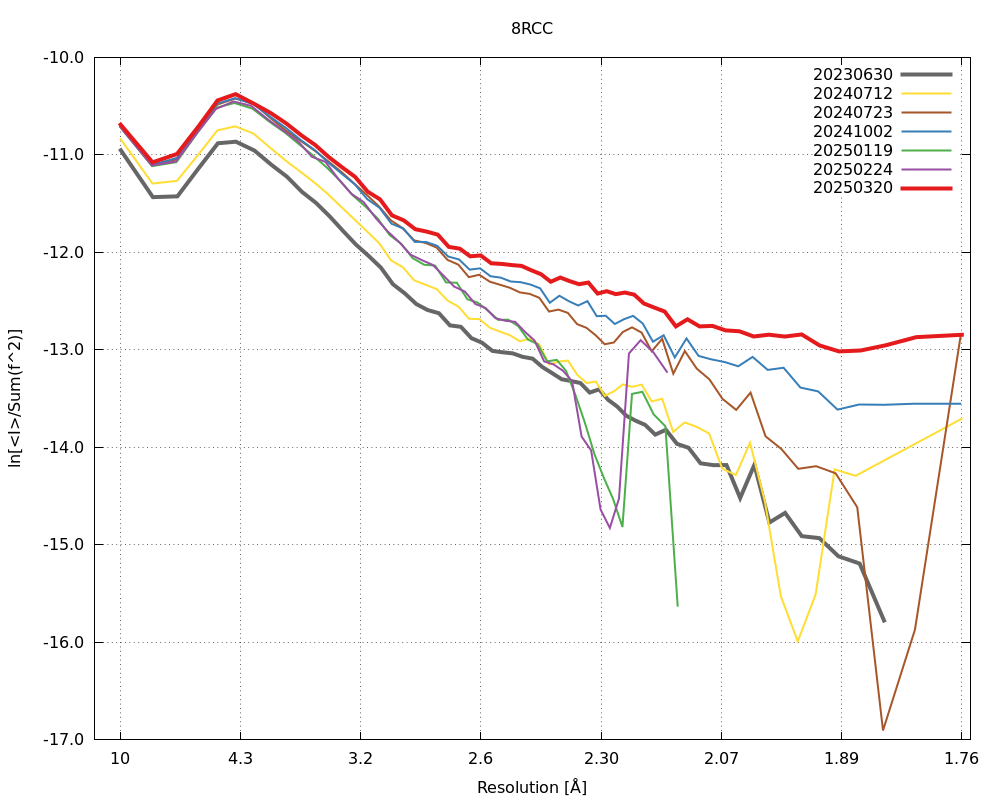 |
| 8SDW | 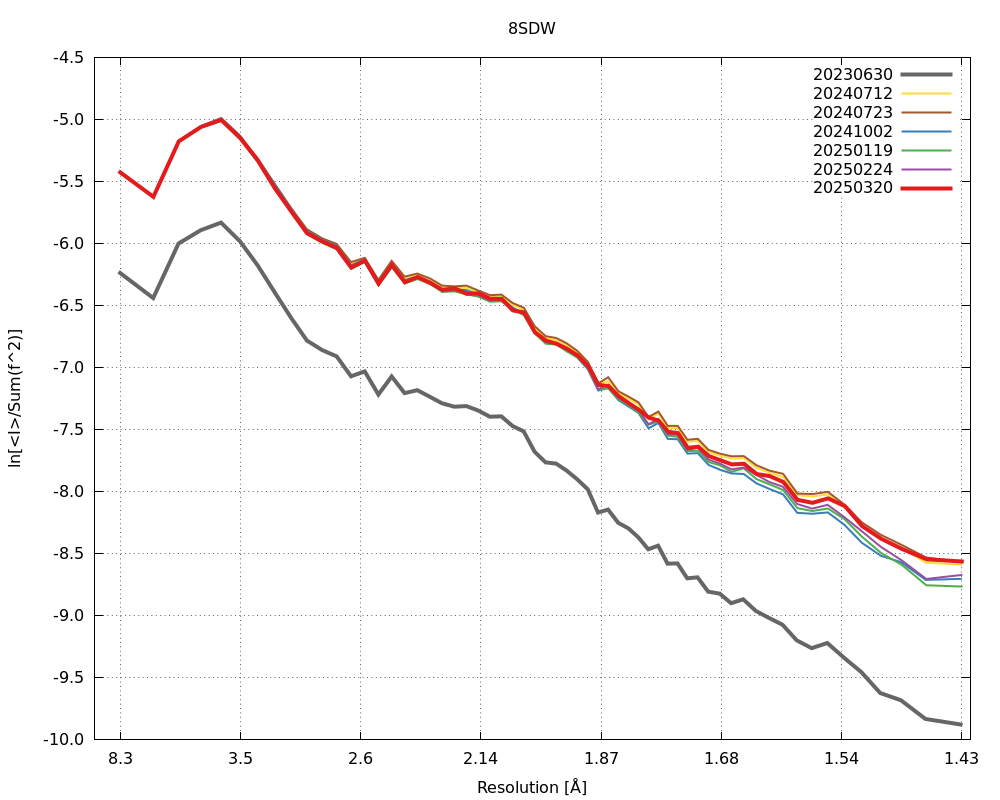 |
| 8SHR | 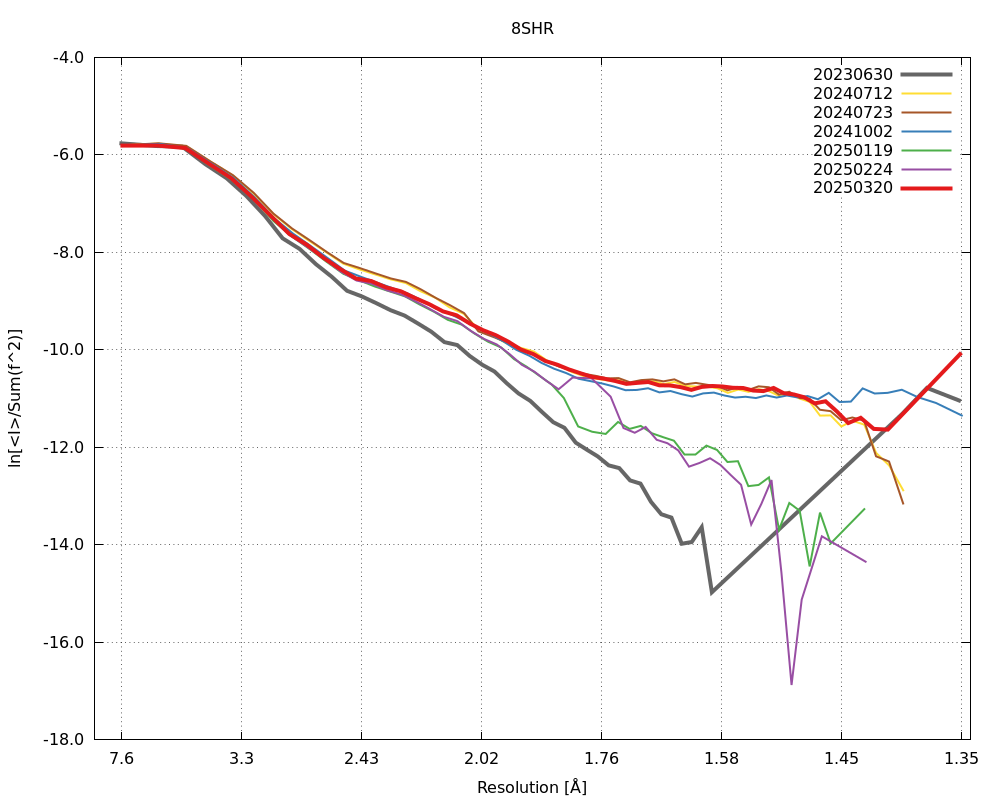 |
| 8SIO | 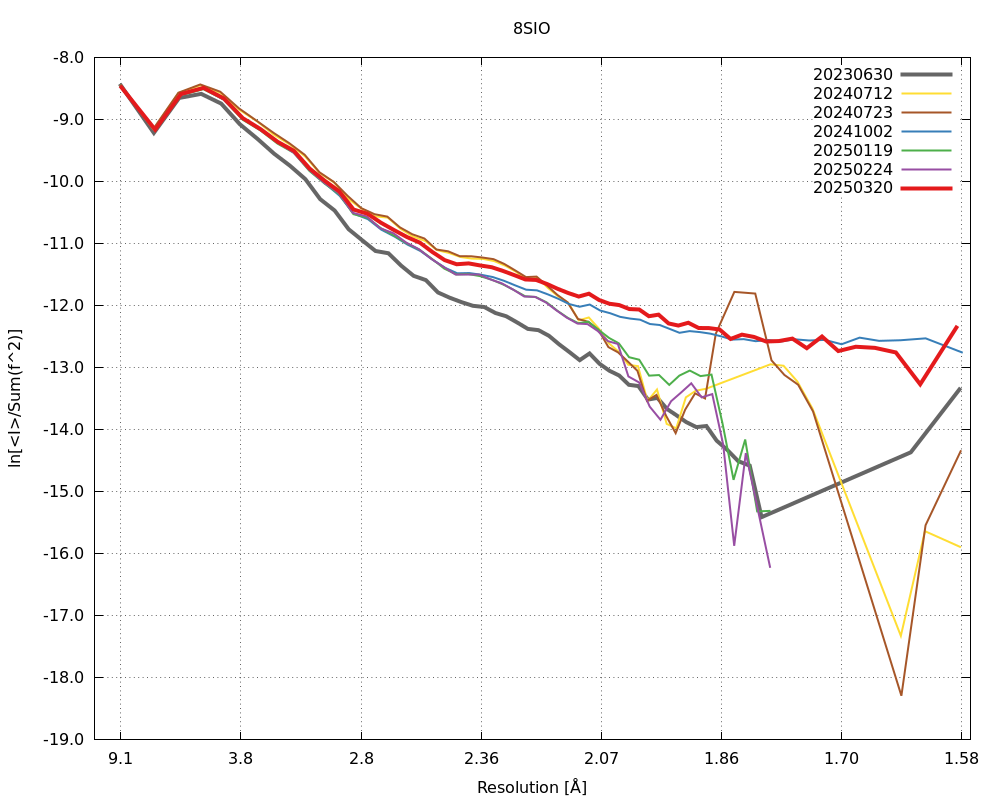 |
| 8SO5 | 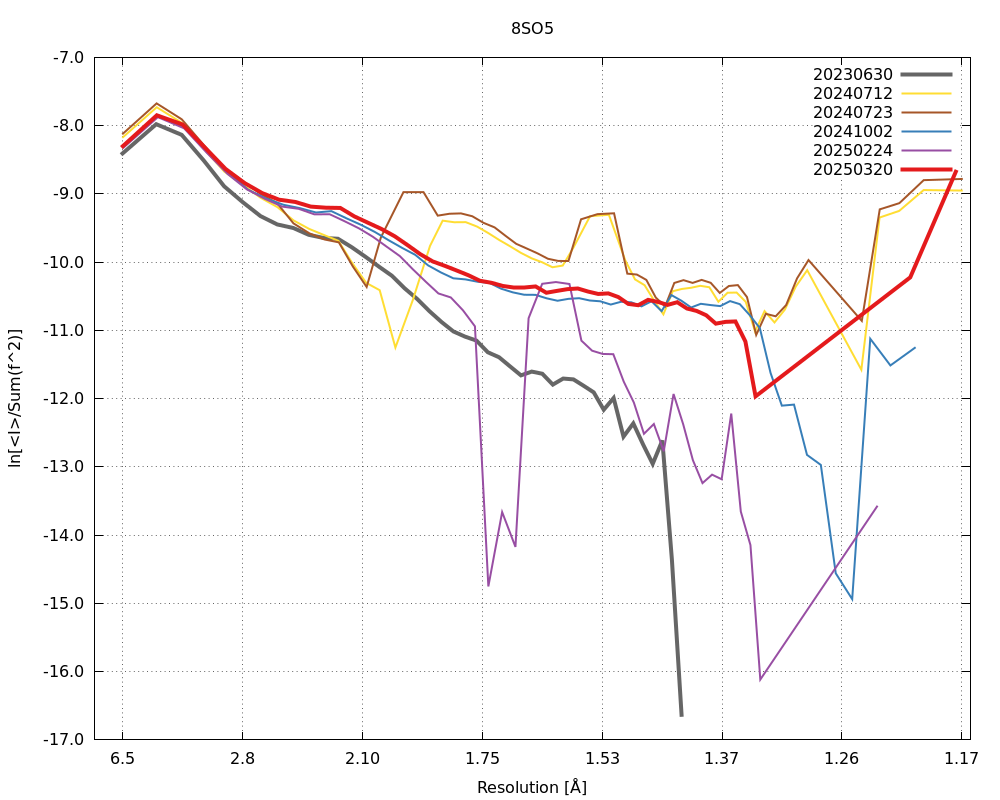 |
| 8TCA | 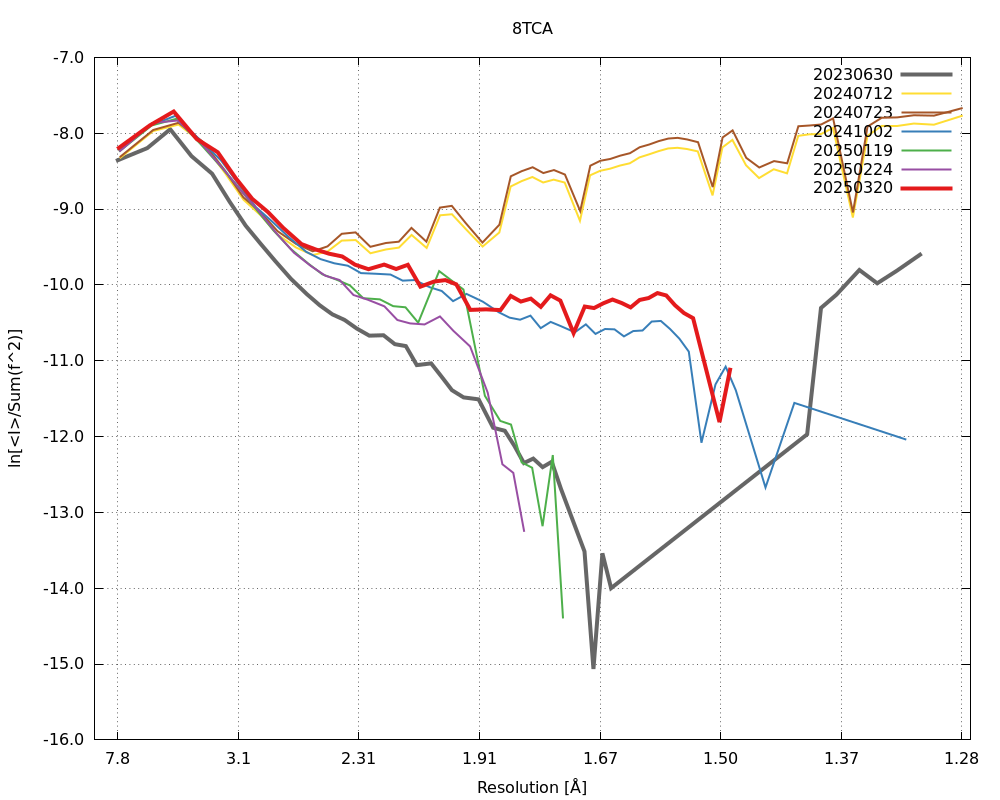 |
| 8UFN | 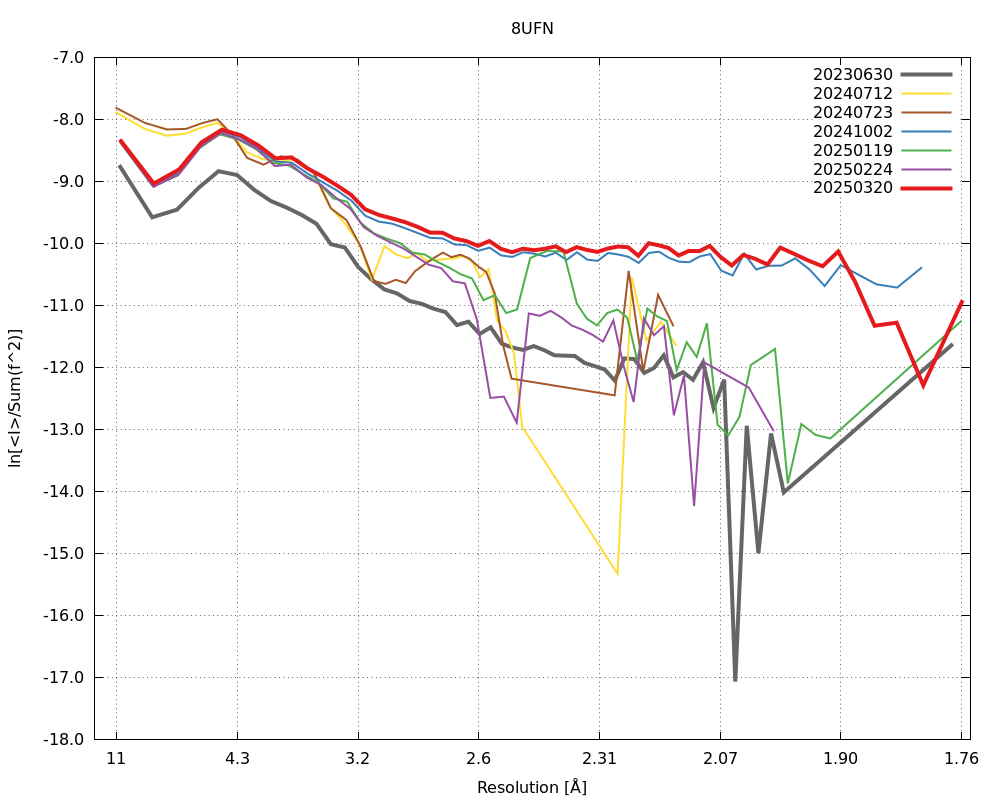 |
| 8VEV | 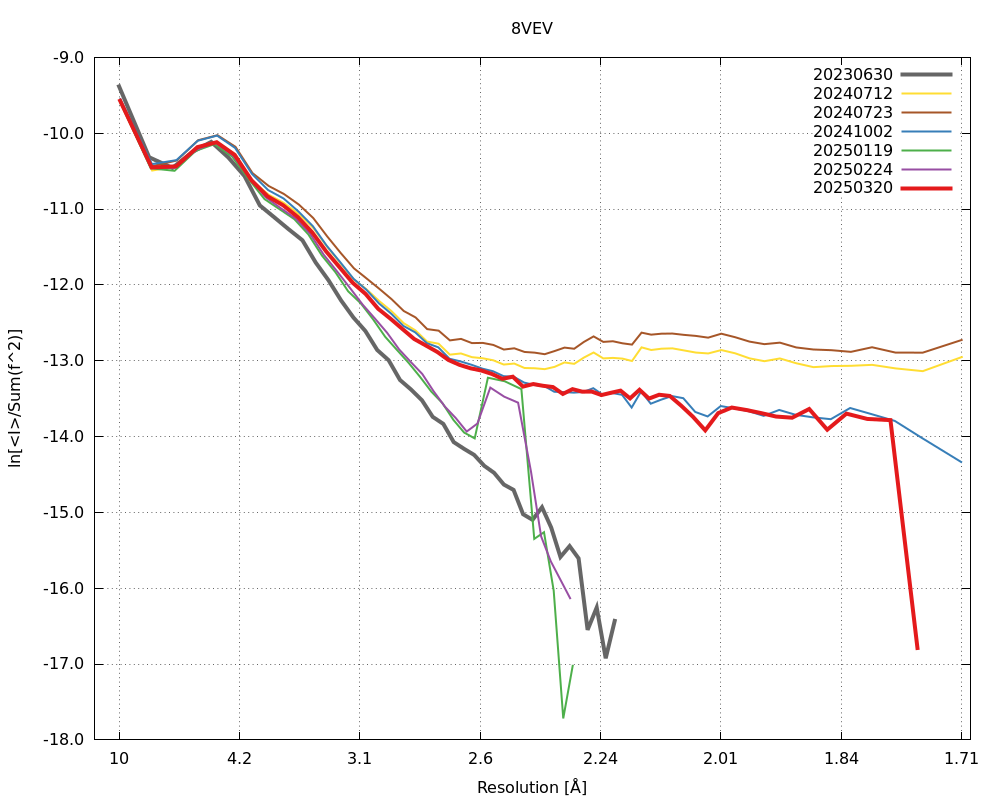 |
| 8WT3 | 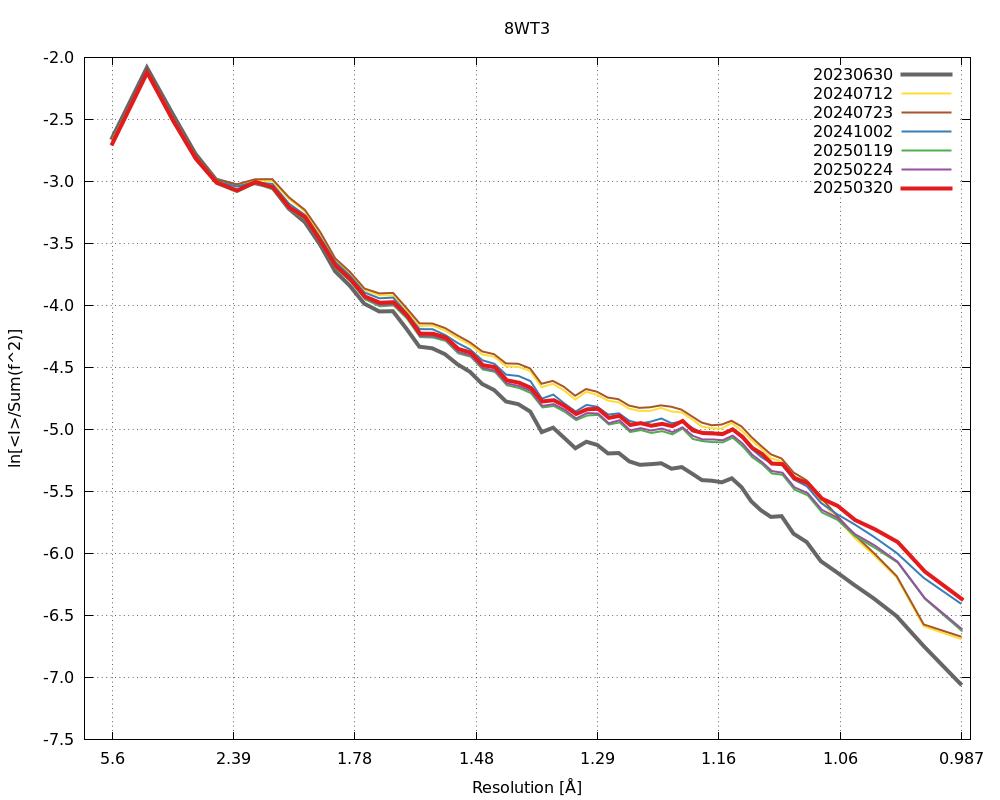 |
| 9CPL | 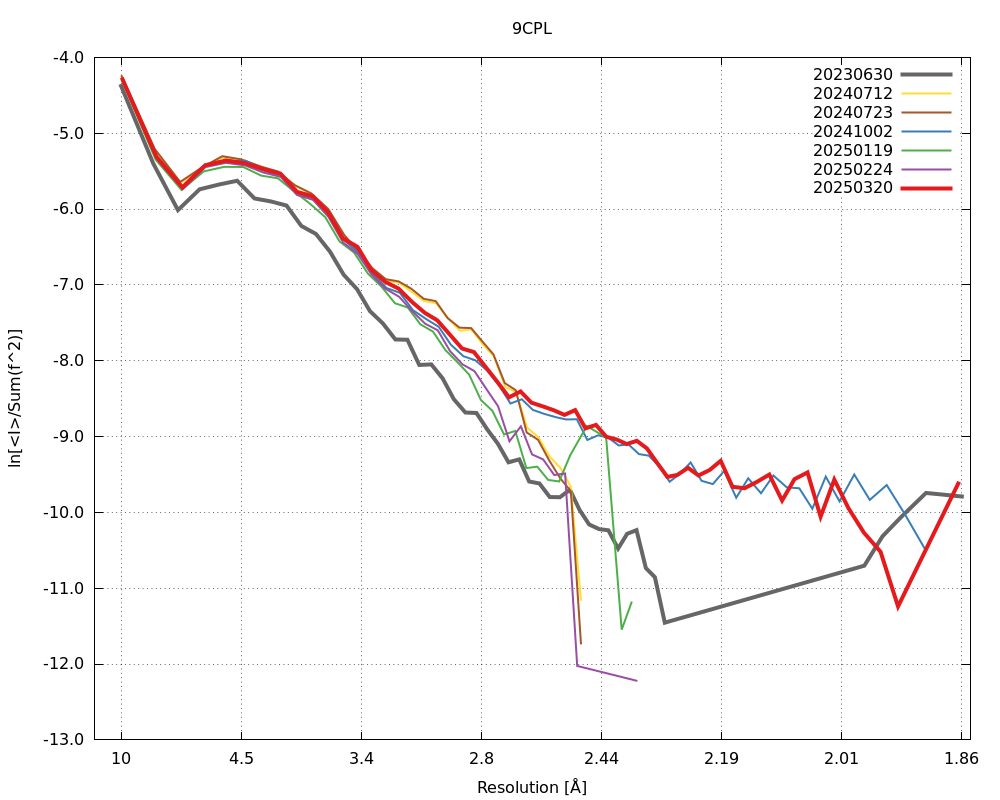 |
Problem computing initial background around marked/masked pixels
Reported to XDS developers on 20250324
The outliers determined by XDS/CORRECT always interested us - especially when they come in unexpected patterns. The recent 2024/2025 XDS versions (20240712 onwards) show a tendency of marking reflections close to the intrinsic module gaps of Pilatus/Eiger detectors as outliers (see examples above). There are several possible reasons for this, including partiality (since reflections close to those gaps will not be fully recorded and their intensity needs to be scaled up according to their partiality estimate) and the "virtual pixels" features of the underlying chip technology (sensors at the border of chips are larger for added stability and therefore cover 2-4 "pixels" in the resulting 2D image array data ... as far as we understand).
However, since the 20230630 version didn't really show a similar tendency - although these are features of the raw data itself - we looked for other explanations, namely the behaviour of the XDS/INIT step in different versions. For this we use some simulated data using our SIMCAL program: background only, no diffraction and including module gaps (i.e. marked as -2). All other pixels contained just some random noise.
From this initial data, we created another set of images where we marked some pixels - similar to those masked/marked pixels one encounters in real detector data:
| type | close-up |
| single | 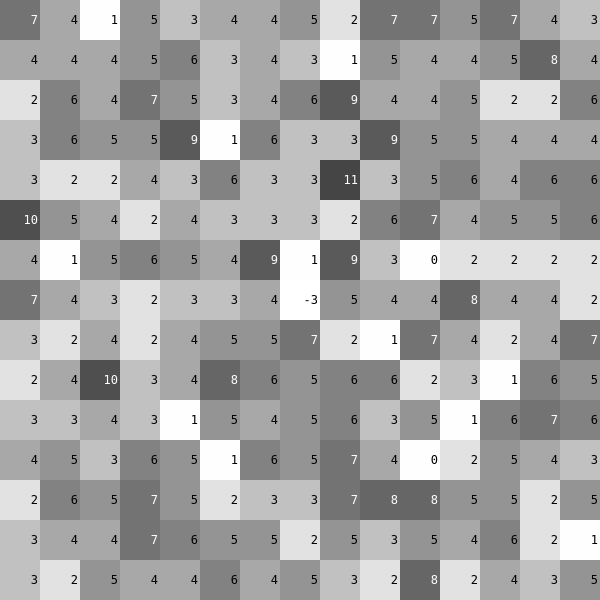 |
| vertical strip | 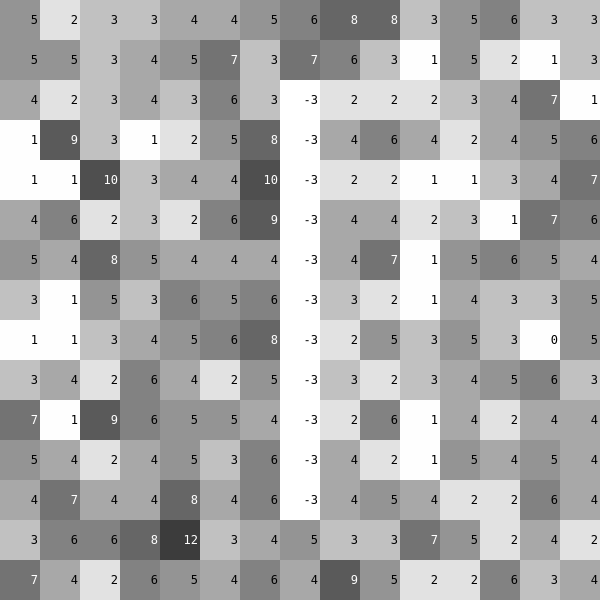 |
| horizontal strip |  |
We can then compare the background (after the XDS/INIT step) between the different XDS versions for the initial background images (top row) and those with the additional markers (bottom row):
| type | close-up (click for larger version) |
| single |  |
| vertical strip |  |
| horizontal strip |  |
The marked/masked pixel is shown in red - which shows that apart from the latest (20250320) XDS version, all previous 2024/2025 versions "lost" that important marker information (which can potentially pose a problem when using the plugin mechanism e.g. on HDF5 datasets).
Or as a wider view:
| type | wide view (click for larger version) |
| single |  |
| vertical strip |  |
| horizontal strip |  |
(we skipped the 20240712 and 20250119 versions since they are identical to the later 20240723 and 20250224 versions, respectively)
As can be seen, all 2024 and 2025 versions show a clear (negative, i.e. lower background value) imprint of the masked pixel in the surrounding background table. Of course, there should be some kind of effect visible (after all, e.g. averaging over a region with fewer observations would give a different mean value), but:
- The effect should be random since (a) the masked pixels are selected randomly and (b) the original values are generated as random noise too.
- The 20230630 version doesn't show such a marked imprint as is visible even for the single pixel example (and especially for the vertical and horizontal strips).
How severe is that imprint? We can compute the absolute difference between the background around those masked pixels:
| type | close-up (click for larger version) |
| single |  |
| vertical strip |  |
| horizontal strip |  |
Or as a wider view:
| type | wide view (click for larger version) |
| single |  |
| vertical strip |  |
| horizontal strip |  |
The difference in background value around those masked pixels is between 2% (for the single pixel case) and up to 8% (for the strips of masked pixels) - within a region of ca 5 pixels to either side.
If we assume that a maximum of 0.01% (i.e. 1 in 10000) damaged pixels are masked for a given pixel-array detector and that each of those impacts significantly ca 2 pixels on either side (i.e. a block of 5x5 = 25 pixels), we could have ca 0.25% of pixels on a detector assigned a likely incorrect background value for integration.
This is for randomly distributed, defect pixels only: a Pilatus 6M detector will have 4 vertical and 11 horizontal (internal) gaps (ignoring the outer edges). If we also ignore the central horizontal gap (because a horizontal spindle axis would mean that those areas are hardly ever integrated anyway) and consider each side of these gaps:
- 4 vertical gaps of length 2527 pixels, each edge of those gaps impacting 2 pixels: 4 x 2 x 2 x 2527 = 40432 pixels
- 10 horizontal gaps of length 2463 pixels, each edge of those gaps impacting 2 pixels: 10 x 2 x 2 x 2463 = 98520 pixels
- (40432 + 98520) / (2527 x 2463) = 2.2% of pixels affected from underestimated background around module gaps
So at the moment it looks as if the increased number of misfits (especially visible around module gaps) is due to a problem in the determination of the initial background in the 2024/2025 XDS versions.
Page started 13th February 2025, 08:03:43 UTC