buster-report help: Ligand Analysis
This help page is for buster-report versions after July 2015. This new page is required because marked improvements have been made to the analysis and presentation. Please note that all ligand validation information is now available in the PDF, XML and TSV files produced in addition to the HTML.
Contents
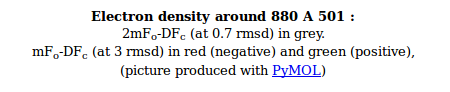
Electron Density Picture
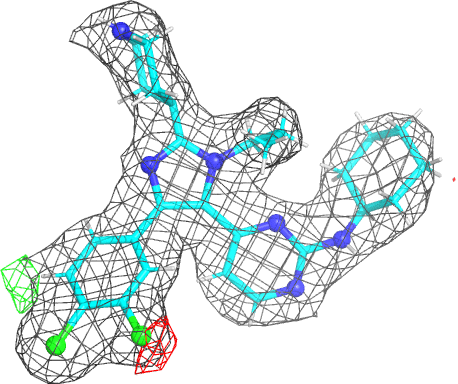
- The picture provides a view of the BUSTER electron density around the ligand. As an example we will use the imidazole-pyrimidine inhibitor 880 from JNK3 kinase structure 1pmq (see Erice tutorial for further information). Running a BUSTER MapOnly run for 1pmq.pdb produces 1pmq.pdb buster-report Ligand Analysis page with the following picture:
- Unfortunately in the PDF version only a static view can be provided see 1pmq.pdb 880 ligand analysis PDF version
- The picture is produced using PyMOL and imagemagick. The animated gif uses a small rotation to give 3D information. Note that animated gif work well in Powerpoint™ presentations. In buster-report if you click on the animated gif you will see a larger static image, that useful if you need a higher resolution.
- The molecule is displayed with bonds to carbon atoms as cyan sticks and hydrogen atoms in thin white sticks. Otherwise standard atomic colors are used, so nitrogen atoms are blue spheres, oxygen atoms are red and chlorine atoms are green.
- The grey mesh shows the BUSTER 2mFo-DFc density map that by default is contoured at 0.7 rmsd. The map is masked to show only the density immediately next to ligand. This map is BUSTER's version of 2Fo-Fc and it shows where the data indicate electron density to be located. The contour level of 0.7 rmsd is set to allow the visualization of weak electron density. For the 1pmq.pdb example above we can see a good fit between the ligand model and the electron density with good coverage for all parts of the ligand (despite one ring being the wrong way around).
- Note that in previous versions of buster-report a level of 1.3 rmsd was used for 2mFo-DFc. This value is more appropriate for well order ligands and at high resolution can show "holes in rings" that are attractive and emphasize the quality of the information.
- You can alter the contour level that are used by buster-report with the command line argument -EDcontours. For instance to use the higher contour level used in previous versions specify -EDcontours 1.3,3.0. To override the default settings using an environment variable set BDG_BR_EDCONTOURS to your desired values.
- The red and green mesh shows the BUSTER mFo-DFc difference density map. This map is BUSTER's version of Fo-Fc indicates regions where the current model has much more or much less electron density compared to the density expected from the data. The red regions mark negative difference density where the atomic model places more electrons than would be expected from the data. The green is used for positive difference density where the atomic model places fewer electrons than expected. The map is contoured at 3.0 rmsd which is quite a low value and some small patches of difference density are normal for good model. In the 1pmq.pdb example above there is a clear patch of negative electron density next to the right-hand chlorine atom in the dichlorophenyl ring as well as a patch of positive difference density on the other side of the ring. This difference density points to the ring adopting two alternate positions (see Erice 1pmq tutorial rebuilding notes).
- For an example of electron density pictures for a poorly refined ligand model see 2h7p on the BusterReport page.
- For an example of an electron density picture for a ligand that can be classified as "absent" see 3ib0 Ligand Analysis page.
Statistics
The statistics table provides information on the ligand including metrics that are useful in judging the quality of a ligand model:
- DatabaseID this is an optional item. If grade_PDB_ligand has been used to generate a dictionary for a known PDB chemical component then a hyperlink will be provided a RCSB page that provides more details (for instance for NAD the link is NAD (PDB)). For in-house ligands the grade command line option -databaseid should be used to provide a corporate ID for the compound. If this is done it is possible for the compound ID to be a hyperlink to a private (intranet) or public web page giving more details.
- 3-letter code if a database ID is used for a compound is available then this used in preference to its three code in the PDB file this cell give the actual three letter code used (for instance XXX, LIG, L01 ,,,,).
- CC(2mFo-DFc) this is the real space correlation coefficient, a measure of how well the ligand's calculated electron density map matches the observed BUSTER electron density map calculated from the data. Value above 0.95 indicate a very good fit. Real space correlation coefficients around 0.90 are generally OK. A values below 0.80 show a poor fit that may well indicate the experimental data do not accord with the ligand placement. For example, the 3ib0 "absent ligand" example has a CC(2mFo-DFc)=0.57 (see 3ib0 Ligand Analysis page).
- min(B-factor) the minimum B-factor for the ligand atoms.
- avg(B-factor) the mean B-factor for the ligand atoms.
- max(B-factor) the maximum B-factor for the ligand atoms. The B-factor is also known as the Debye-Waller_factor or "temperature factor" and is a quantity indicating the spread of the atom in the refined model. It units are Å squared. A value approaching 80 Å squared indicate the atom is spread very widely and the ligand may be disordered.
- min(occ) the minimum occupancy of any atom in the ligand.
- max(occ) the maximum occupancy of any atom in the ligand.
- Mogul Analysis this provides a number of metrics from an analysis of the ligand geometry by Mogul - see the next section for details.
Mogul Analysis: Overview
- buster-report can include analysis of ligand geometry using the Mogul program from CCDC. For each bond, bond angle, torsion angle and ring Mogul identifies chemically similar structures from the CSD database of small molecule structures. The distribution of each the bond length, bond angle, torsion angle and 5 or 6-membered ring then analysed.
- buster-report reads the Mogul analysis and presents the results as a 2D schematic pictures as there are easy to understand. Currently OpenBabel obabel is used to generate the 2D coordinates used and PyMOL the actual pictures. The pictures are color-coded from green (good) to purple (bad). These colors were chosen to be clear for everyone including color-blind people and replace an older "traffic-light" method that was unclear. Both the HTML and PDF versions of the report first present an overview of all the Mogul results:
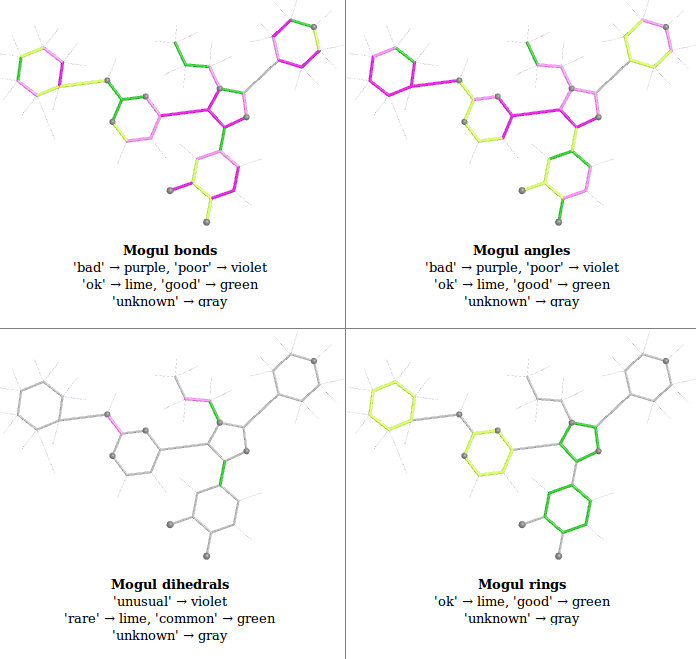
- this overview is from 1pmq.pdb buster-report Ligand Analysis page and shows results for an old structure refined with indifferent restraints to demonstrate the range of colors used.
- To find out more about a particular analysis click on the "Details" link (HTML) look at the subsequent page (PDF report). This will show a detailed results sections. Explanations for each can be found below in sections for: Bonds and Angles, Dihedrals and Rings
- Note that re-refinement with decent restraints can sort out most of these issues (see tutorial).
Mogul Bond and Angle Analysis
- For each bond length and bond angle the mean and standard deviation of the distribution is found. The Z value is then calculated by finding the difference in the actual bond length in refined structure and mean CSD value and dividing by the standard deviation.
- The 2D schematic picture is then rendered with the following color coding on absolute Z:
- The relevant part of this classification is also quoted below a 2D schematic figure of the ligand in the Detailed report with a table listing individual results. For example see bond analysis for 1pmq.pdb html version or PDF version.
- If grade with Mogul is used as a source of restraints then bond and angle Z values should be small and the any "poor" or "bad" indications should be looked at carefully.
Mogul Dihedral Analysis
- The Mogul program provides analysis for individual torsion angles in the molecule. For each torsion angle a search for similar molecules in the CSD is built up and this is used to construct a histogram showing the number of structures in the CSD with the angle in a particular 10 degree bin. It should be noted that as a large proportion of structures in the CSD are centrosymmetric it makes sense to perform the analysis in the range 0 to 180 degrees and to compare with the absolute value of the torsion angle in the candidate structure.
- buster-report takes the histogram that Mogul for each of the torsion angle in a ligand and produces a schematic picture of the histogram. The schematic shows the number of matched torsions found in the CSD in the range 0 degrees to 180 degrees.
- We will use the 1pmq.pdb 880 ligand Dihedral Analysis as an example. The first part of this looks like:
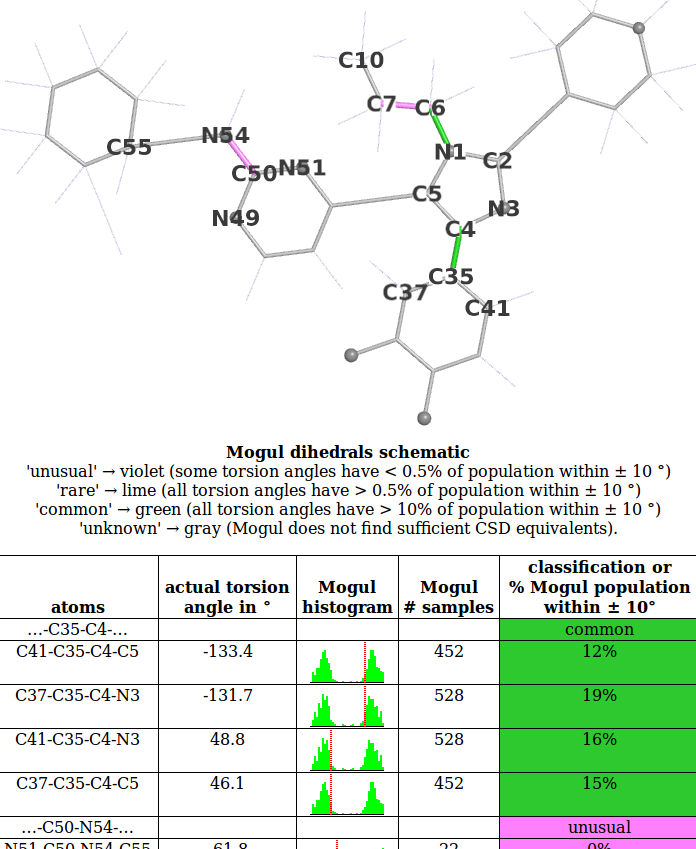
- Look at the histogram for the first torsion presented involving atoms C41-C35-C4-C5. Compare this with the histogram produced for this torsion if the Mogul program is run interactively:
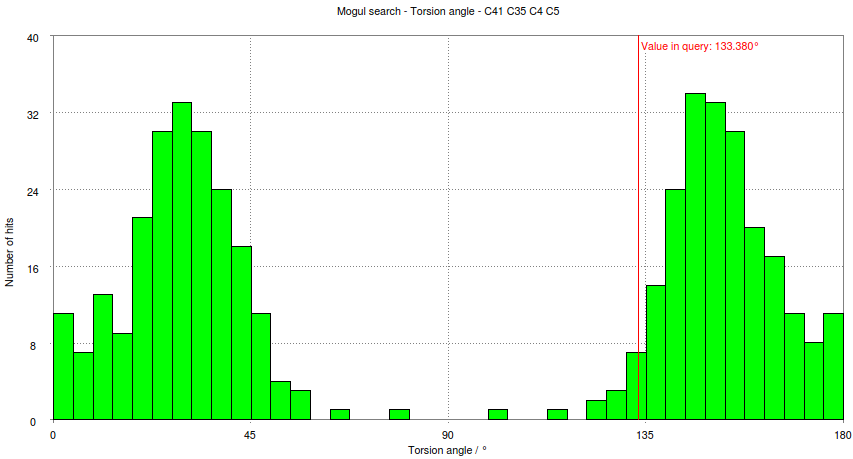
- This shows how the small schematic histogram show the same information as the interactive program.
- In this case the observed torsion angle for C41-C35-C4-C5 is -133.4 degrees, so its absolute value is 133 degrees as marked on both the schematic and large histogram. The histogram analysed and used to classify the observed torsion as 'common'. The criterion used is:
- It should be noted that this classification does NOT include an equivalent of 'bad' for bond lengths. This is because 'unusual' does not mean wrong. Notice that in the CSD histogram there are structures whose torsion angle is around 80 degrees. The CSD structures are not wrong but rather than have unusual packing or internal conformation that produces an atypical torsion angle. In a protein complex the presence of an 'unusual' torsion angle in a ligand is something that should be checked but taken alone is not an indication of an error. Conversely a common torsion angle is encouraging but taken alone is not an indication of success!
- buster-report goes on to group torsion angles that involve the same two central atoms into 'dihedrals'. A dihedral is counted as 'unusual' if any of its torsions are 'unusual', 'rare' if it is not 'unusual' and any of its torsions are 'rare' and 'common' if it is not 'rare'. This allows for the torsion angle analysis results to rapidly conveyed by a colored 2D schematic. In the example above the dihedral ...-C35-C4-... has 4 separate torsion angles that are all 'common' so the dihedral is 'common'.
- A more interesting example is provided by the next dihedral ...-C50-N54-... that is classified as unusual. As described in the Erice tutorial this is a case where 'unusual' is an indication that the ligand model needs to be revised.
Mogul Ring Analysis
- Mogul analyses the conformation of 5 and 6-membered rings by finding rings with equivalent atom types in the CSD and comparing the root mean square deviation of the torsion angles within the ring. Please see Mogul documentation for a full explanation.
- buster-report uses a 'ring strangeness score' that is the RMS difference in torsion angles between the instance of the ring in the ligand in the model, and the nearest instance that mogul finds in the CSD.
- A classification is made on the ring strangeness score (ringSS) with the following scheme:
- The ring analysis is useful as a validation measure as these parameters are sensitive to the ligand placement and fitting. A poor ring score is an indication that a ring is in an unusual pucker and should be examined in detail. This is particularly true of saturated rings. For example the poorly refined ligand in 2h7p has usual puckers for both a 5-membered and 6-membered saturated rings see 2h7p.pdb Ligand Analysis page that can be fixed by re-refinement with a reasonable restraint dictionary, see 2h7p re-refined Ligand Analysis page.
Page updated July 2015. Please address problems, corrections and clarifications to buster-develop@globalphasing.com