BUSTER example specifying column and flag value for free set reflections
The MTZ file must contain a column containing a specification of the set of reflections used to compute eg. Rfree. By default that column has the name: FreeR_flag.
To select a different column name (for refine versions above 1.11.2) use eg.:
% refine ... ColumnName_FreeR_flag=TEST
In previous releases (refine versions 1.11.2 and below) one also had to specify the allowed names eg.:
% refine ColumnName_FreeR_flag_allowed=' I[ ]* FreeR_flag| I[ ]* TEST'
Usually the subset of reflections that has a flag value of '0' is called "the free set" and the rest are called "the work set". If one wants to select a different flag value use eg.:
% refine ... BusterFreeFlagValue=1
What are the tell-tale signs of selecting a 'new' free-set?
Lets try on 2fri. Start with these two files:
From running
% mtzdmp 2fri/2fri.mtz > 2fri/2fri.mtzdmp
we see that
- the column name containg the flag is: FREE, and it
- has min and max values: 0 and 22, respectively.
First let's see what the Rwork and Rfree values are for these sets by running a MapOnly job for each value of the values 0 to 22:
% for q in $(seq -w 0 22) ; do
%     refine -m 2fri.mtz -p 2fri/2fri.pdb -M MapOnly BusterFreeFlagValue=$q -d ${q} &> ${q}.log &
% done
Since the column name "FREE" is automatically detected as being the column with the FreeR_flag we do not need to specify it explicitly.
When the jobs are finished do:
% grep best ??.log | awk '{print $NF}'|sed -e 's%/% %' > q.dat
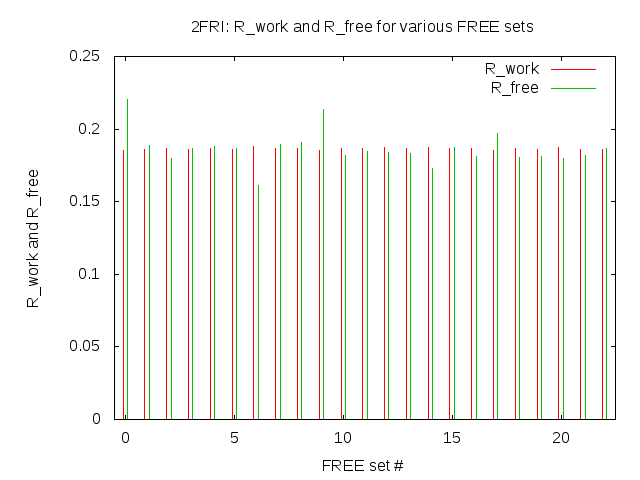
Plot the values using eg. gnuplot to get:

We see only a small variation.
Secondly, what happens if one selects a new free-set?
Let's try running a refinement using the original set (00) and two other sets: 10 and 20.
% for q in 00 10 20; do
%     refine -p 2fri/2fri.pdb -m 2fri/2fri.mtz BusterFreeFlagValue=$q -d run$q  &> run${q}.log &
% done
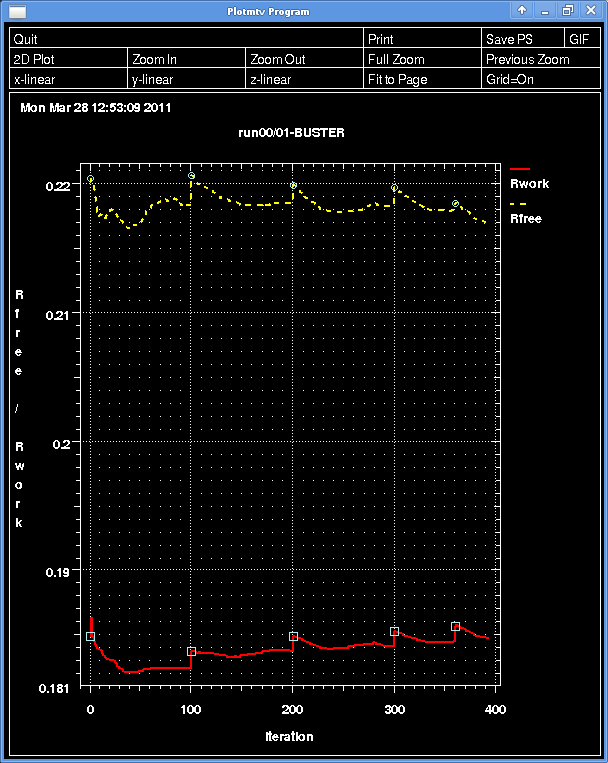
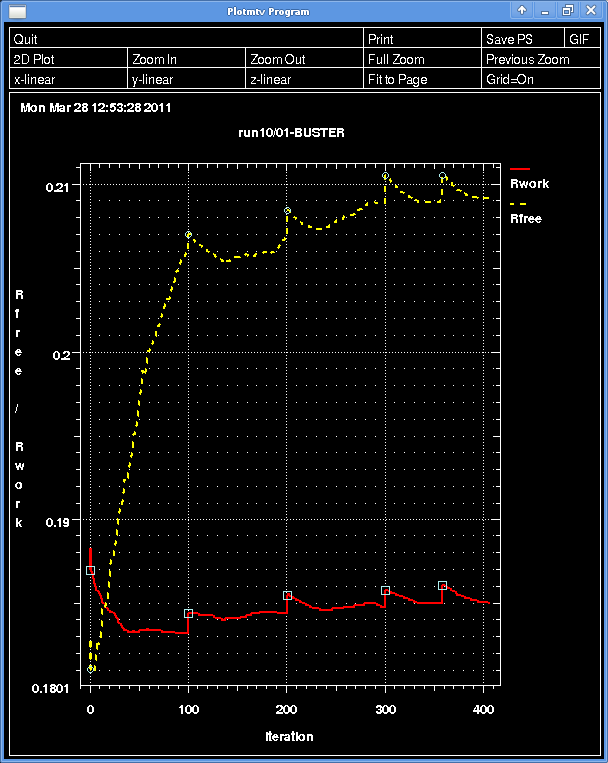
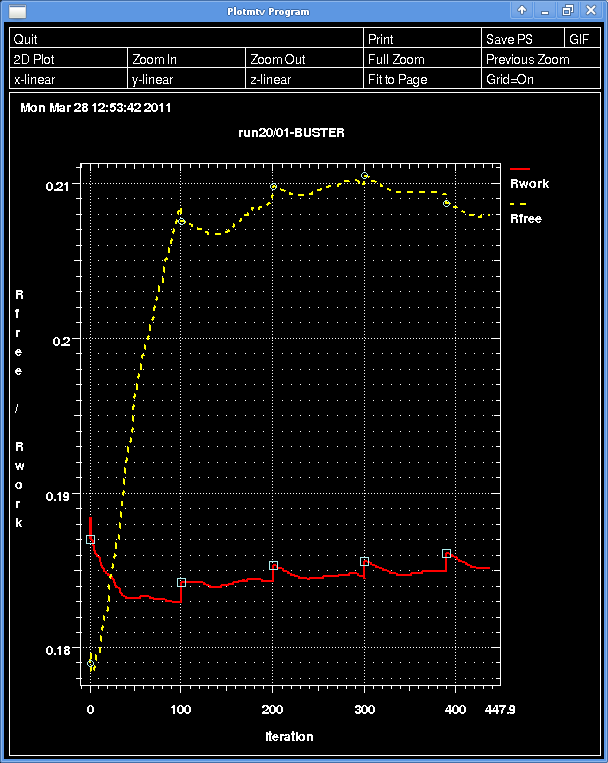
Use the graph_autobuster_R and plotmtv tools to obtain these plots showing how Rwork and Rfree behave when selecting a 'new' free set:
Original

Free set 10

Free set 20

Note how the new sets start off with a Rfree lower than Rwork, while after some refinement, the structure has 'forgotten' the free set and the Rfree value is somewhat larger than Rwork.