From the session website: We often collect data that, for a variety of reasons, contain spots with less-than-ideal shape/properties. This dataset is a good example of a 'typical' membrane protein dataset with a long unit cell axis. Note that the data for this example are organized in three directories representing the three wavelengths used for collection: peak wavlength ('pk'), inflection point ('ip') and high-remote wavelength ('hrem'). All three wavelengths will be necessary for successful phasing. |
Content:
Just running
% find_images
shows 3 datasets:
SK3_2_###.img  : 0 - 269
SK3_4_###.img  : 0 - 360
SK3_5_###.img  : 0 - 360
We have images with an image number zero: these are often direct-beam shots (to get very accurate direct beam position). Let's check:
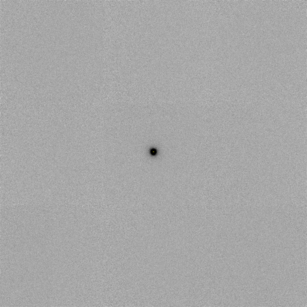
From that direct-beam shot image, we can read the direct beam centre in pixels as (X,Y)=(1535,1528). Does that fit with the image header information?
% imginfo *001.img
gives
################# File = SK3_2_001.img

>>> Image format detected as MARCCD

===== Header information:
date                                = 24 Nov 2006 13:32:00
exposure time             [seconds] = 2.000
distance                       [mm] = 370.000
wavelength                      [A] = 0.971500
Phi-angle (start, end)     [degree] = 0.000 0.500
Oscillation-angle in Phi   [degree] = 0.500
Omega-angle                [degree] = 0.000
Chi-angle                  [degree] = 0.000
2-Theta angle              [degree] = 0.000
Pixel size in X                [mm] = 0.073242
Pixel size in Y                [mm] = 0.073242
Number of pixels in X               = 3072
Number of pixels in Y               = 3072
Beam centre in X               [mm] = 113.232
Beam centre in X            [pixel] = 1546.000
Beam centre in Y               [mm] = 114.088
Beam centre in Y            [pixel] = 1557.689
Overload value                      = 65535

################# File = SK3_4_001.img

>>> Image format detected as MARCCD

===== Header information:
date                                = 24 Nov 2006 15:39:51
exposure time             [seconds] = 1.000
distance                       [mm] = 370.000
wavelength                      [A] = 0.979000
Phi-angle (start, end)     [degree] = 0.000 0.500
Oscillation-angle in Phi   [degree] = 0.500
Omega-angle                [degree] = 0.000
Chi-angle                  [degree] = 0.000
2-Theta angle              [degree] = 0.000
Pixel size in X                [mm] = 0.073242
Pixel size in Y                [mm] = 0.073242
Number of pixels in X               = 3072
Number of pixels in Y               = 3072
Beam centre in X               [mm] = 113.232
Beam centre in X            [pixel] = 1546.000
Beam centre in Y               [mm] = 114.088
Beam centre in Y            [pixel] = 1557.689
Overload value                      = 65535

################# File = SK3_5_001.img

>>> Image format detected as MARCCD

===== Header information:
date                                = 24 Nov 2006 16:15:15
exposure time             [seconds] = 1.000
distance                       [mm] = 370.000
wavelength                      [A] = 0.979200
Phi-angle (start, end)     [degree] = 0.000 0.500
Oscillation-angle in Phi   [degree] = 0.500
Omega-angle                [degree] = 0.000
Chi-angle                  [degree] = 0.000
2-Theta angle              [degree] = 0.000
Pixel size in X                [mm] = 0.073242
Pixel size in Y                [mm] = 0.073242
Number of pixels in X               = 3072
Number of pixels in Y               = 3072
Beam centre in X               [mm] = 113.232
Beam centre in X            [pixel] = 1546.000
Beam centre in Y               [mm] = 114.088
Beam centre in Y            [pixel] = 1557.689
Overload value                      = 65535
Since this is a Se-MET experiment, it looks like
SK3_2_###.img = hrem
SK3_4_###.img = peak
SK3_5_###.img = infl
In what order were they collected? We run
% imgdate.sh -s *.img > img.lis
to get
# sorted list of: file, Epoch, Date, seconds-to-previous
SK3_2_000.img 1164375106  24 Nov 2006 13:31:46 0
SK3_2_001.img 1164375120  24 Nov 2006 13:32:00 14
SK3_2_002.img 1164375124  24 Nov 2006 13:32:04 4
...
SK3_2_269.img 1164375954  24 Nov 2006 13:45:54 3
SK3_4_000.img 1164382776  24 Nov 2006 15:39:36 6822
SK3_4_001.img 1164382791  24 Nov 2006 15:39:51 15
SK3_4_002.img 1164382794  24 Nov 2006 15:39:54 3
...
SK3_4_360.img 1164383908  24 Nov 2006 15:58:28 3
SK3_5_000.img 1164384901  24 Nov 2006 16:15:01 993
SK3_5_001.img 1164384915  24 Nov 2006 16:15:15 14
SK3_5_002.img 1164384918  24 Nov 2006 16:15:18 3
So we have a large gap between the last hrem image (but maybe something went wrong there, since the images stop with 269 and not the 360 images we have for the other wavelengths) and the first peak image. There is also a larger gap (about 15 minutes) between the peak and infl dataset: maybe that is the time it takes to change wavelength (and realign beam) on that beamline - or maybe it is a different crystal or a different part of the same crystal?
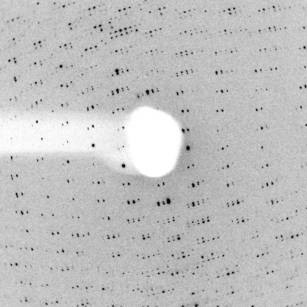
It's always a good idea to not just looking at the first image, but a few images at different viewing angles (relative to the first image), eg. +30, +60 and +90 degree:
| Image | Full | Centre region | Upper left |
| SK3_2_001.img |  |
 |
 |
| SK3_2_061.img |  |
 |
 |
| SK3_2_121.img |  |
 |
 |
| SK3_2_181.img |  |
 |
 |
The first image shows relative nice lunes, but also already some split (?) spots. This becomes worse with later images.
The first images for all three wavelengths (hrem, peak and infl) show nearly identical diffraction patterns (apart from a slight scaling due to the change in wavelength). So it is most likely that the datasets come from the same crystal - but if they were collected on the same spot of the crystal or on a fresh spot is still unclear.
This looks like a challenging example with possibly multiple lattices - so a slightly more complex approach for running autoPROC:
% process -M automatic -d 01 | tee 01.lis
This will read a so-called macro (named "automatic") to set various parameters which could especially improve the initial indexing stage. To see a list of available (and/or user-defined):
% process -M list
This will give a F222 solution with
Summary data for   Project: Test Crystal: A Dataset: 0.971500

                                           Overall  InnerShell  OuterShell
---------------------------------------------------------------------------
  Low resolution limit                      68.142      68.142       3.200
  High resolution limit                      3.189      14.752       3.189

  Rmerge                                     0.103       0.034       0.296
  Ranom                                      0.090       0.025       0.268
  Rmeas (within I+/I-)                       0.112       0.032       0.347
  Rmeas (all I+ & I-)                        0.114       0.038       0.345
  Rpim  (within I+/I-)                       0.065       0.019       0.217
  Rpim  (all I+ & I-)                        0.049       0.017       0.172
  Total number of observations              332783        1878        1459
  Total number unique                        62862         408         425
  Mean(I)/sd(I)                               14.7        37.0         3.8
  Completeness                                98.1        56.7        68.2
  Multiplicity                                 5.3         4.6         3.4

  Anomalous completeness                      95.6        55.3        57.8
  Anomalous multiplicity                       2.8         2.7         1.9
Summary data for   Project: Test Crystal: A Dataset: 0.979000

                                           Overall  InnerShell  OuterShell
---------------------------------------------------------------------------
  Low resolution limit                      68.142      68.142       3.494
  High resolution limit                      3.483      14.752       3.483

  Rmerge                                     0.126       0.061       0.222
  Ranom                                      0.111       0.051       0.202
  Rmeas (within I+/I-)                       0.132       0.060       0.242
  Rmeas (all I+ & I-)                        0.137       0.067       0.242
  Rpim  (within I+/I-)                       0.070       0.032       0.132
  Rpim  (all I+ & I-)                        0.053       0.028       0.096
  Total number of observations              309564        4125         698
  Total number unique                        47265         697         111
  Mean(I)/sd(I)                               13.9        29.7         8.4
  Completeness                                95.7        96.9        22.7
  Multiplicity                                 6.5         5.9         6.3

  Anomalous completeness                      93.4        95.3        22.6
  Anomalous multiplicity                       3.4         3.5         3.2
Summary data for   Project: Test Crystal: A Dataset: 0.979200

                                           Overall  InnerShell  OuterShell
---------------------------------------------------------------------------
  Low resolution limit                      68.142      68.142       3.340
  High resolution limit                      3.330      14.752       3.330

  Rmerge                                     0.148       0.046       0.312
  Ranom                                      0.137       0.039       0.308
  Rmeas (within I+/I-)                       0.160       0.046       0.377
  Rmeas (all I+ & I-)                        0.160       0.051       0.347
  Rpim  (within I+/I-)                       0.083       0.025       0.215
  Rpim  (all I+ & I-)                        0.061       0.021       0.148
  Total number of observations              363672        4079         461
  Total number unique                        54321         696          92
  Mean(I)/sd(I)                               13.3        36.1         5.6
  Completeness                                96.4        96.8        17.4
  Multiplicity                                 6.7         5.9         5.0

  Anomalous completeness                      93.8        93.2        16.7
  Anomalous multiplicity                       3.5         3.5         2.6
and files:
Can those already be used for solving the structure? See the autoSHARP tutorial.