WORK-IN-PROGRESS
Crystal Structure of ADP ribose phosphatase of NSP3 from SARS CoV-2

Kim, Y., Jedrzejczak, R., Maltseva, N., Endres, M., Mececar, A.,
Michalska, K., Joachimiak, A., Center for Structural Genomics of
Infectious Diseases (CSGID)

To be published.
Data was collected on 21st February 2020 on beamline 19-ID (SBC-CAT, APS) on a Pilatus3 6M and refined to 2.00 A using Phenix.
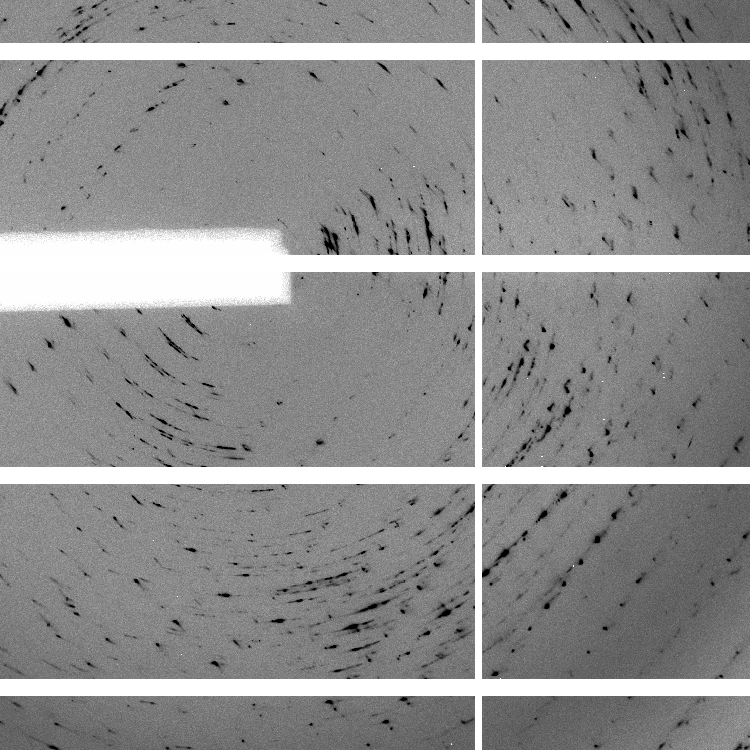
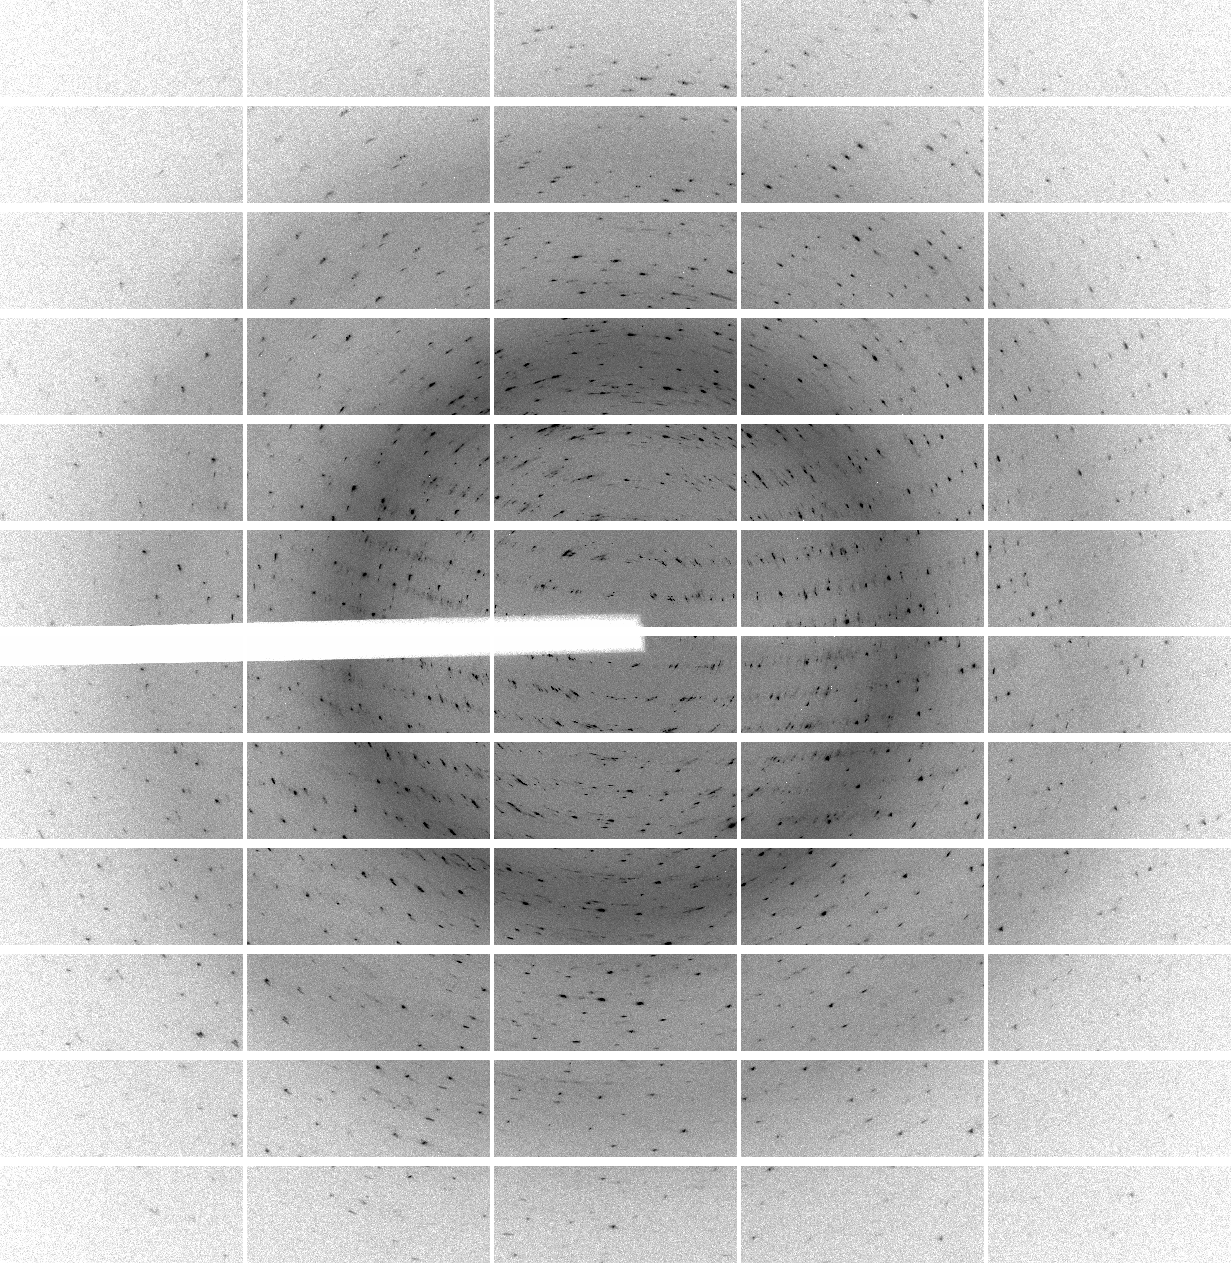
We have two sweeps of data with 800 images each, all collected with 0.5 deg/image and 0.5 sec/image. The same caveats/questions as for 6W9C can be applied here: this is high-dose, low-multiplicity, wide-sliced data when ideally we would like to see low-dose, high-multiplicity, fine-sliced data collected on a low-noise pixel-array detector using shutterless data collection.
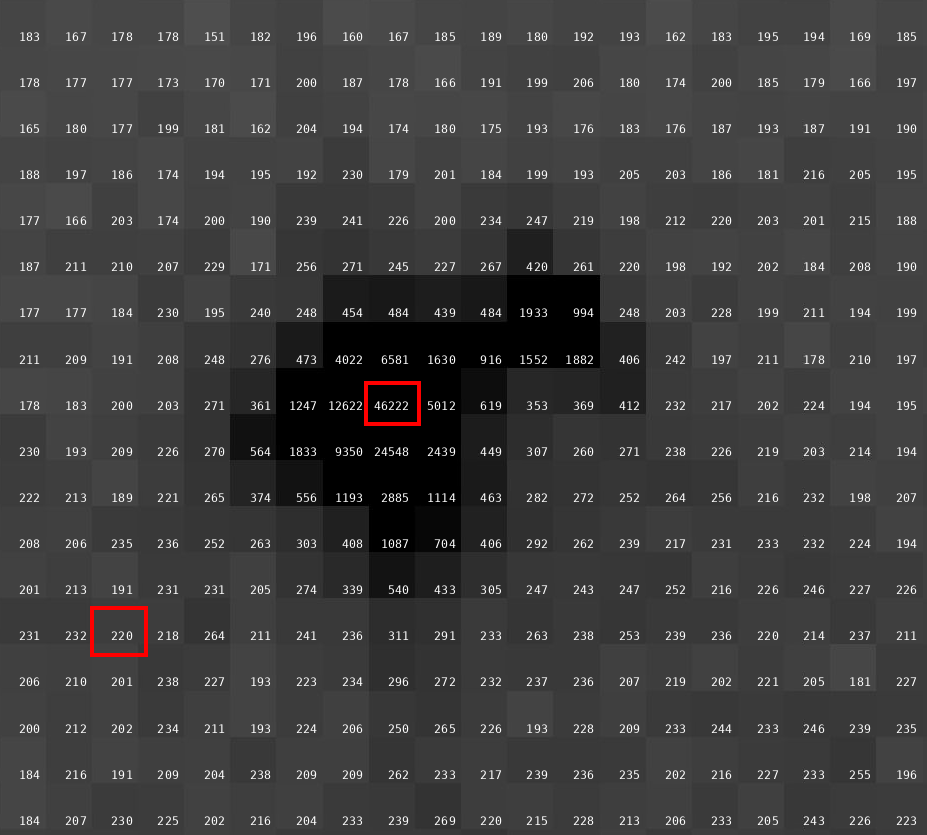
But this data is even more extreme: we have a typical background count of nearly 300 counts (!) on those images:
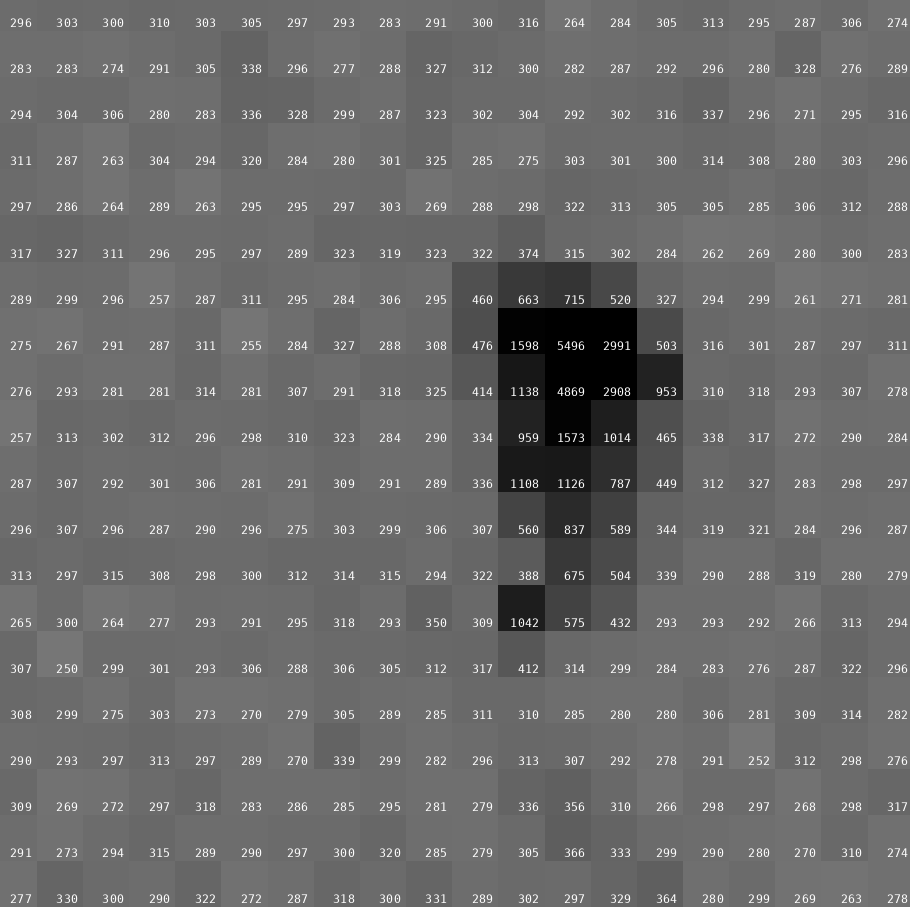
We could have easily used 1% of the dose going into those 0.5 degree of data ... and together with fine-slicing (to avoid potential spatial overlaps of spots) it would have most likely been a much better approach to avoid radiation damage and achieve higher multiplicity, better scaling and outlier rejection.
Running autoPROC via
process -I Images ReverseRotationAxis=yesgives us some obvious indications regarding the problems of the used collection strategy (looking at the resulting summary.html file):
| Sweep 1 | Sweep 2 |
  |
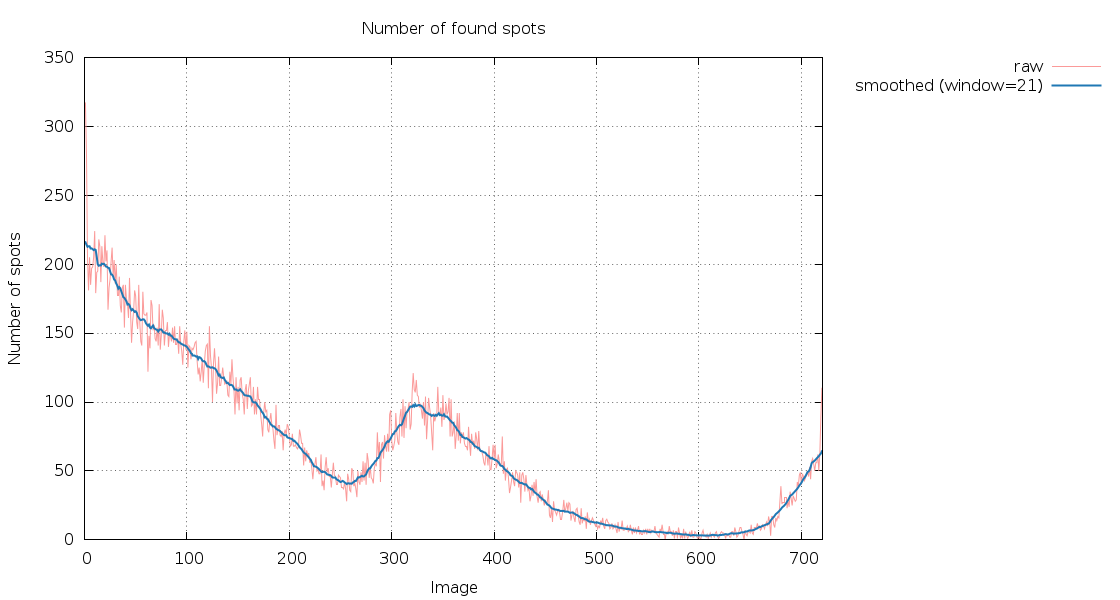 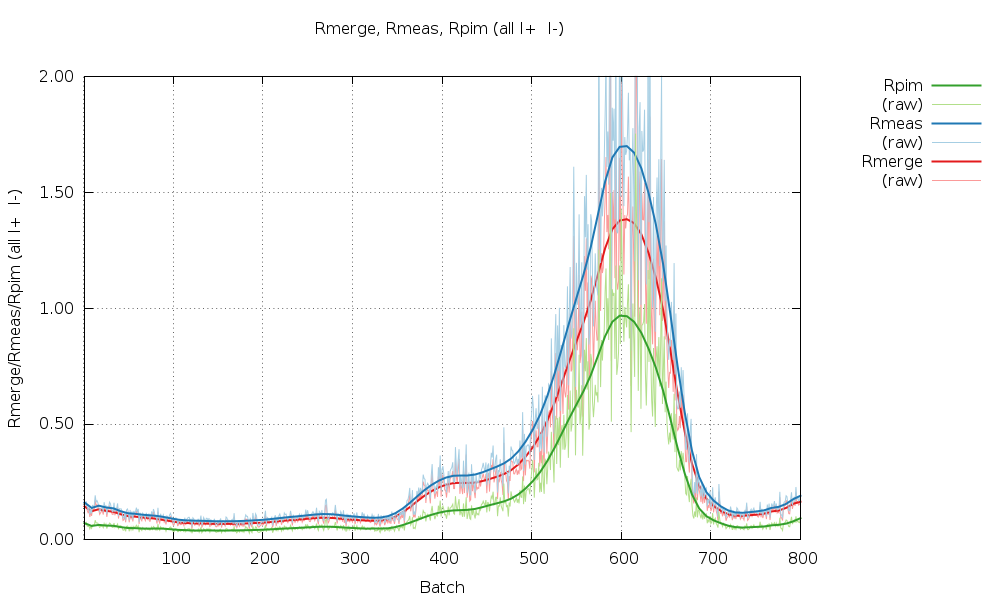 |
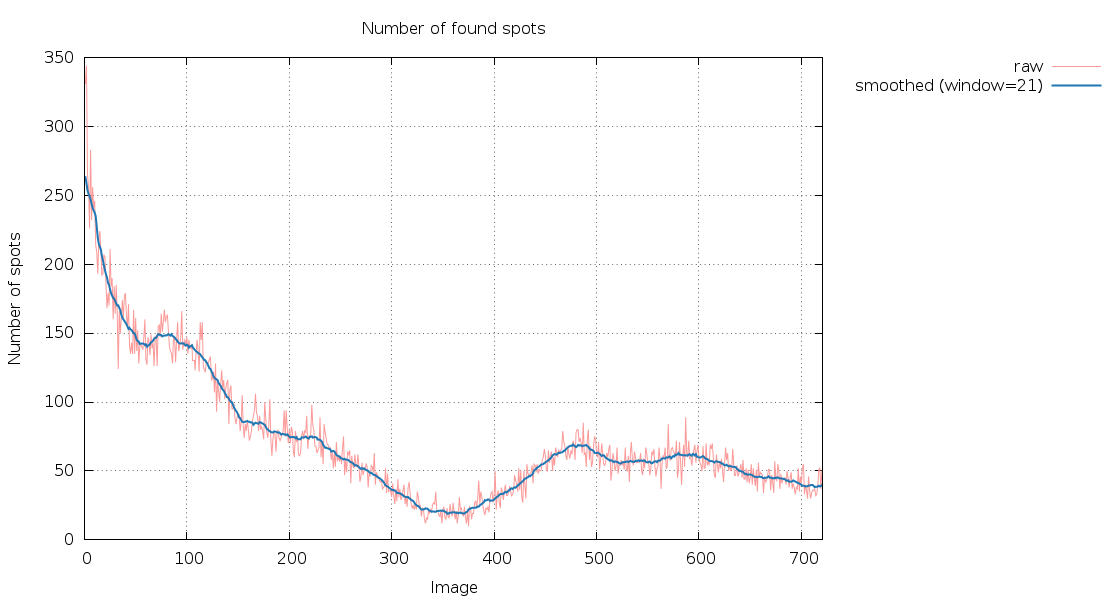
The number of spots found as a function of image number is rapidly decreasing (and since these are 400 degrees of data in each sweep, we would normally expect to have the sanme number of spots again after having rotated a full 360 degree circle). There are also clearly two very poor sections in each sweep: after about 300 images (150 degrees) in sweep 1 and after about 350 images (175 degrees) in sweep 2:
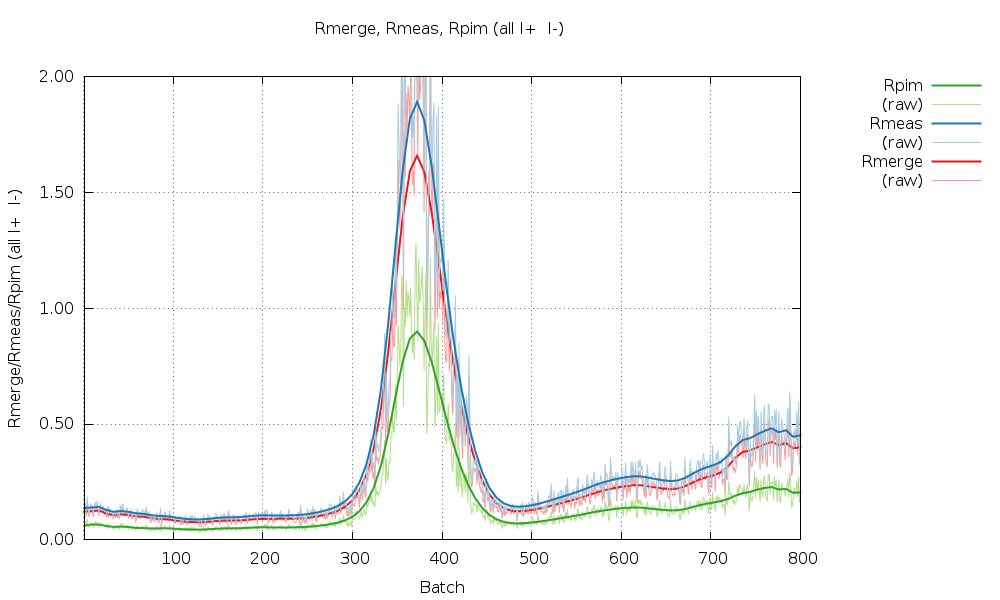
Especially sweep 1 also shows an underlying trend of increasing R-values with image number (i.e. dose).
We should probably use only parts of those two sweeps for processing:
| Sweep 1 | Images 1 - 300 | Omega = –280 - –130 (150 degree) |
| Sweep 2 | Images 1 - 350 | Omega = –70 - +105 (175 degree) |
Those ranges should contain the least damaged parts of the two sweeps and still provide a fairly complete P1 dataset). So running
    process \
      -Id 2a,Images,m1a2peg-2_#####.cbf,1,300 \
      -Id 3a,Images,m1a2peg-3_#####.cbf,1,350 \
      ReverseRotationAxis=yes
to give us
Spacegroup name P1
Unit cell parameters 30.1468 37.7807 64.8130 95.8014 97.9852 90.1138
Wavelength 0.97918 A
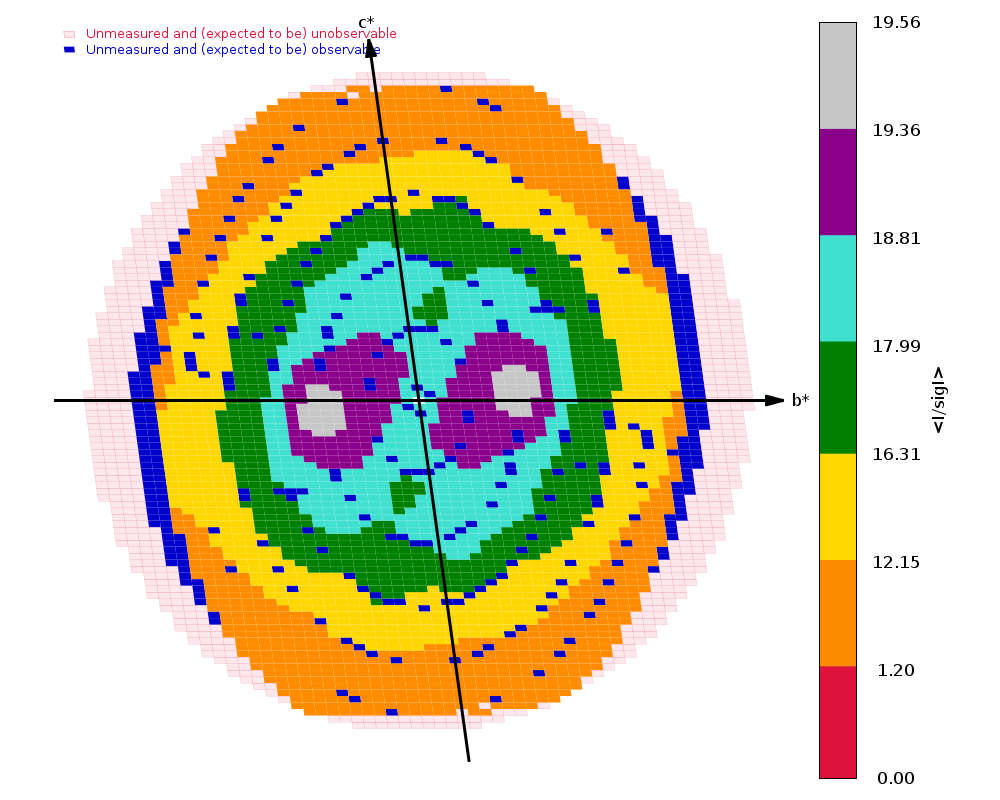
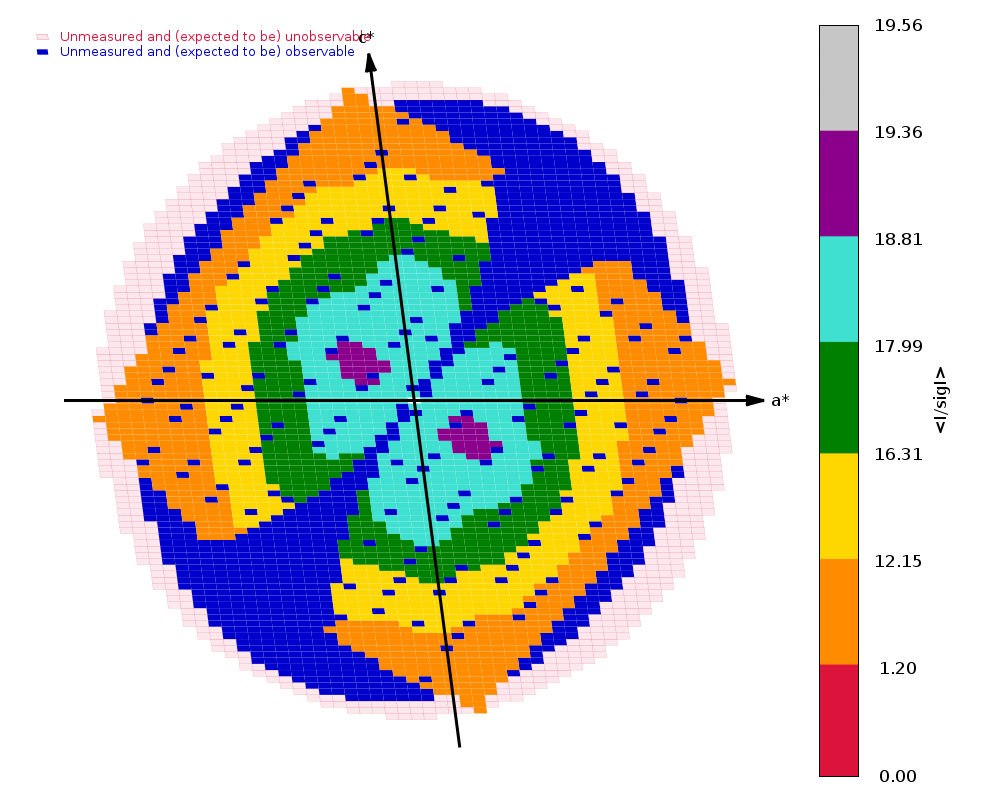
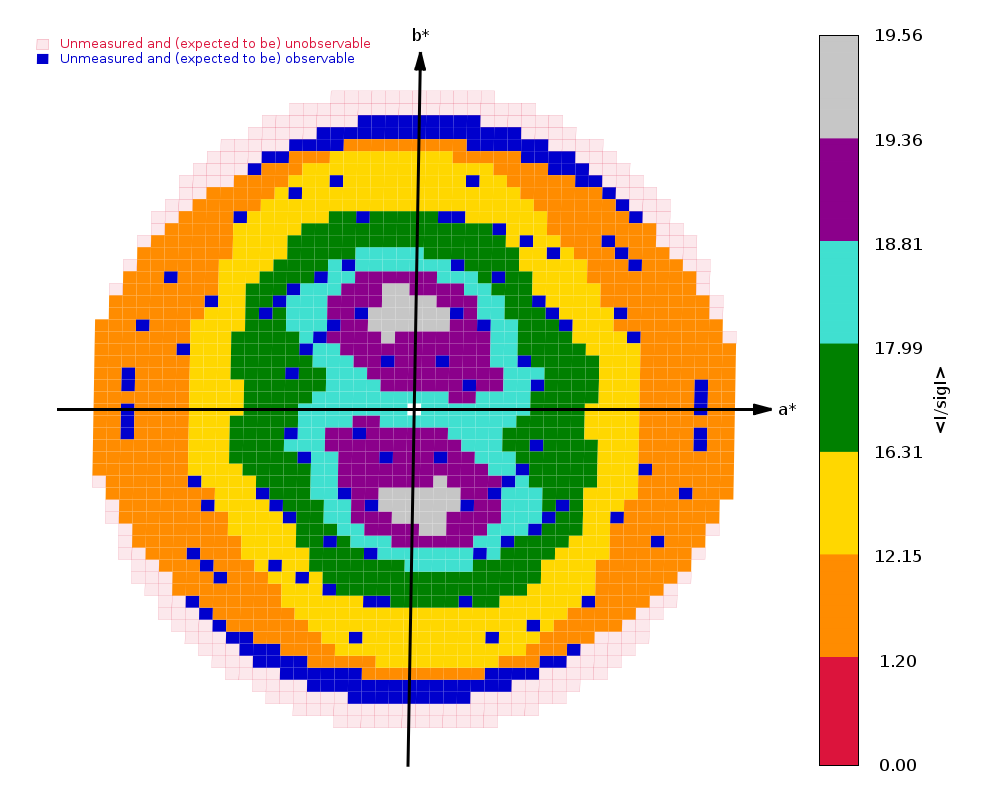
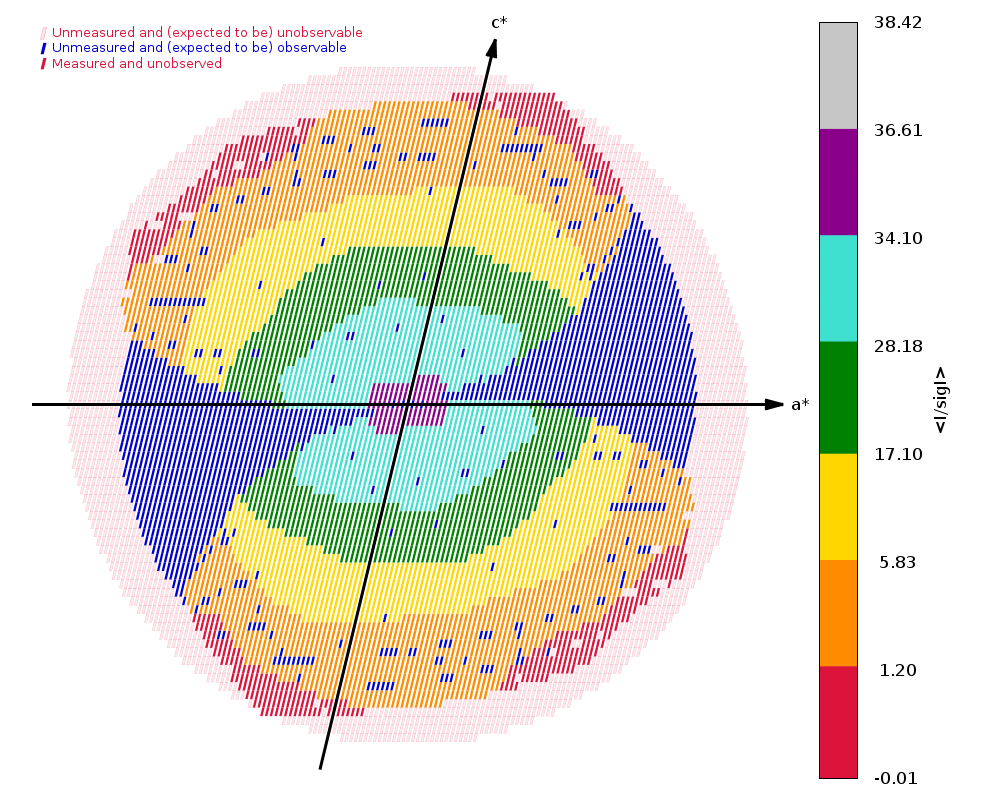
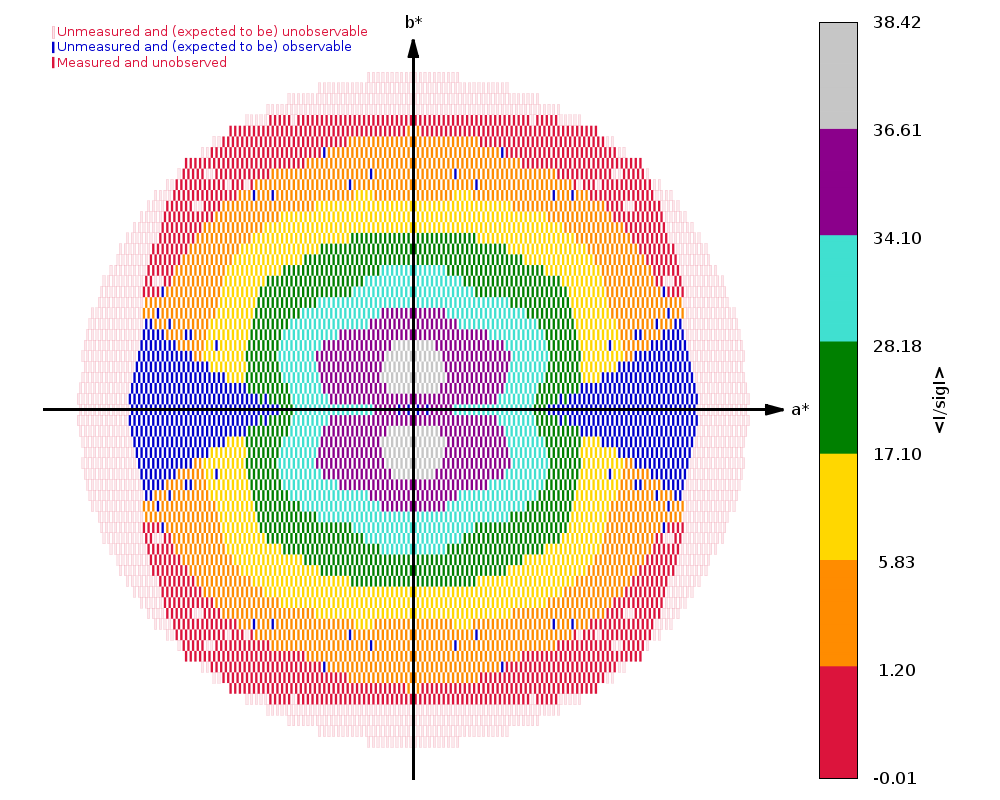
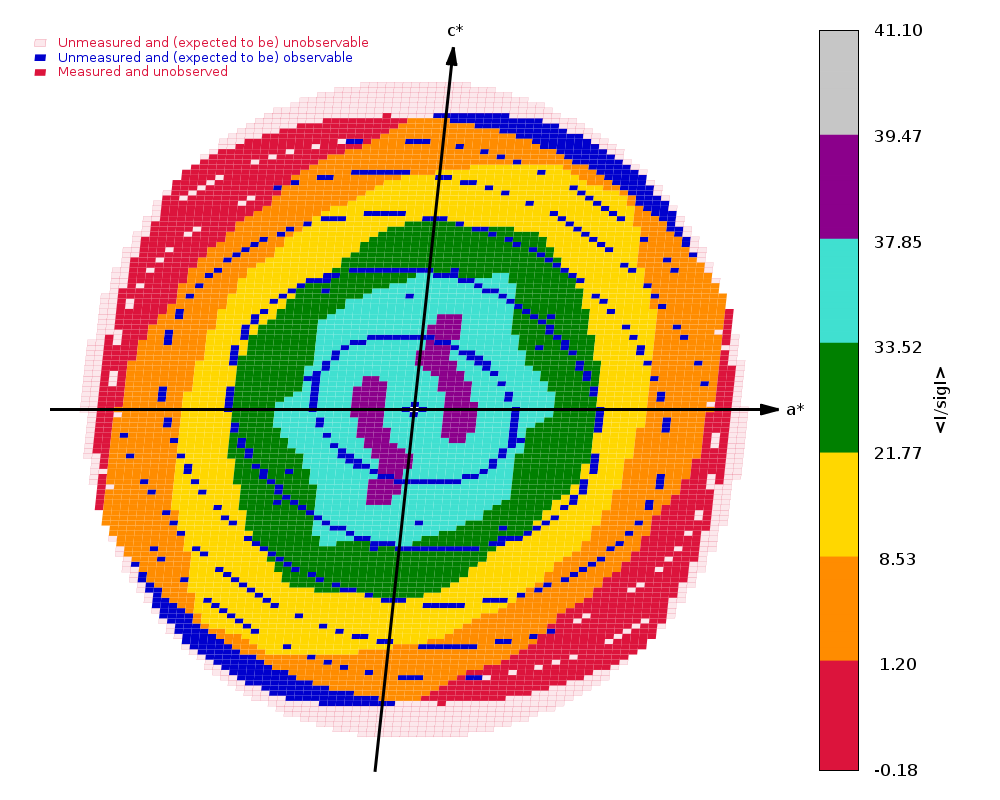
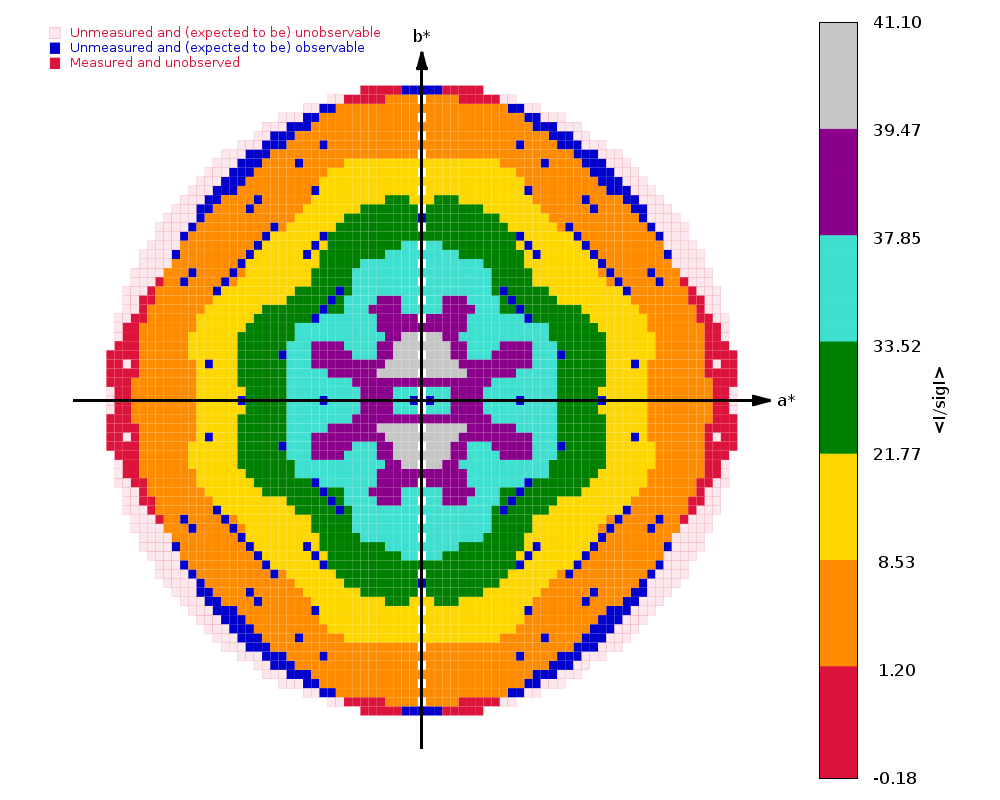
Diffraction limits & principal axes of ellipsoid fitted to diffraction cut-off surface:
1.517 0.9416 -0.2737 0.1963 0.922 _a_* - 0.338 _b_* + 0.190 _c_*
1.561 0.1406 0.8490 0.5094 0.103 _a_* + 0.776 _b_* + 0.622 _c_*
1.361 -0.3061 -0.4520 0.8379 -0.148 _a_* - 0.274 _b_* + 0.950 _c_*
Number of RUNs (sweeps) contributing to this dataset = 2
Criteria used in determination of diffraction limits:
-----------------------------------------------------
local(I/sigI) >= 1.20
Overall InnerShell OuterShell
---------------------------------------------------------------------------
Low resolution limit 37.582 37.582 1.485
High resolution limit 1.361 3.749 1.361
Rmerge (all I+ & I-) 0.115 0.053 1.297
Rmeas (all I+ & I-) 0.142 0.067 1.553
Rpim (all I+ & I-) 0.082 0.040 0.845
Total number of observations 111570 6592 5173
Total number unique 37349 2535 1643
Mean(I)/sd(I) 12.5 31.8 1.4
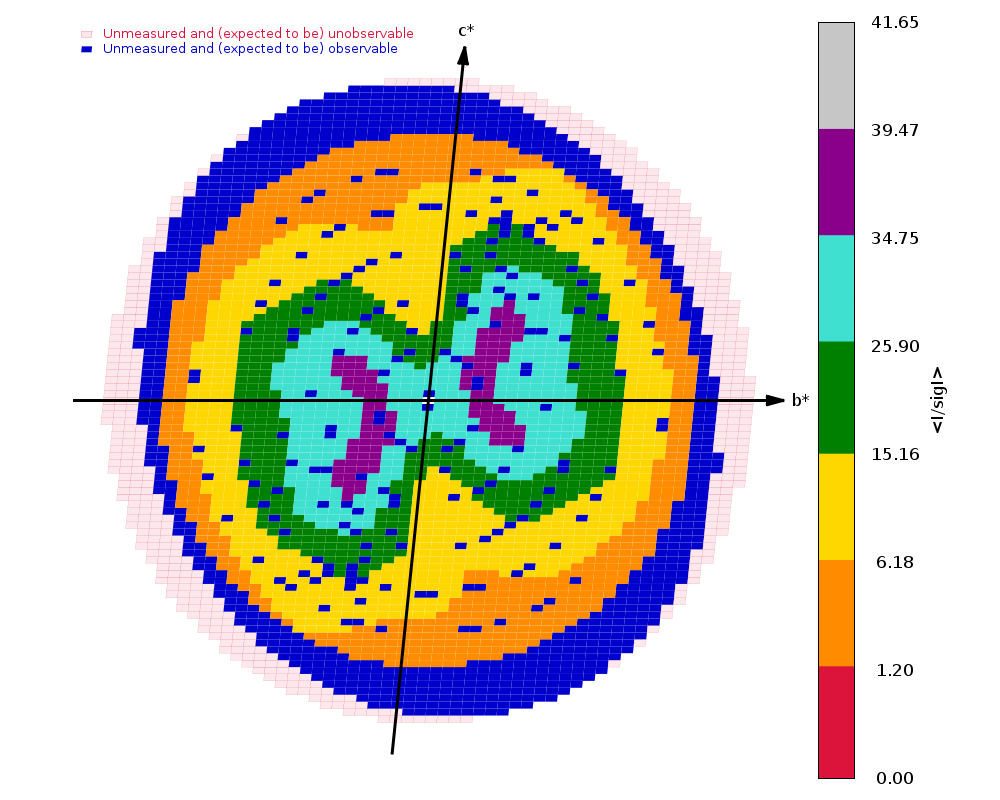
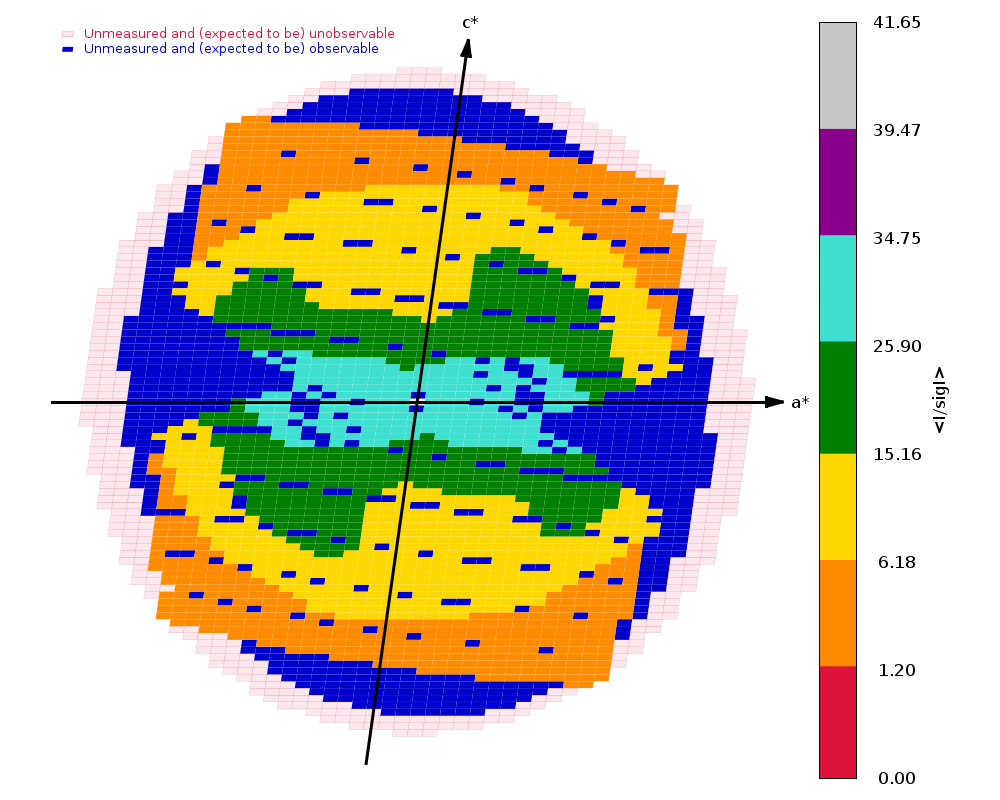
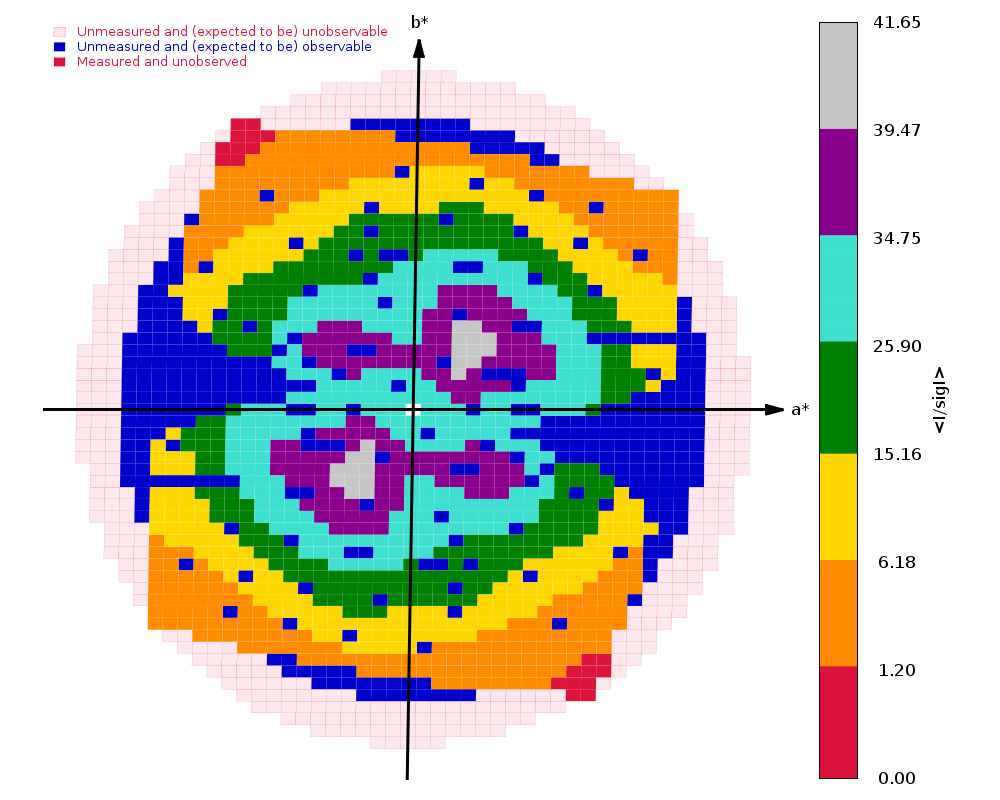
Completeness (spherical) 61.8 88.6 11.9
Completeness (ellipsoidal) 75.2 88.6 14.2
Multiplicity 3.0 2.6 3.1
CC(1/2) 0.990 0.987 0.138
 |
 |
 |
Files:
In order to analyse for radiation damage (using the F(early)–F(late) map analysis done automatically in [BUSTER https://www.globalphasing.com/buster/), we need to select the relevant "early" and "late" part from the two seeps manually - all assuming that these are collections on different (fresh) parts of the same crystal.
    aP_scale \
      -mtz combine.mtz \
      -P 6VXS 2a early -b 1001-1150 \
      -P 6VXS 2a late  -b 1151-1300 \
      -P 6VXS 3a early -b 2001-2175 \
      -P 6VXS 3a late  -b 2176-2350 \
      -id EarlyLate | tee EarlyLate_aP_scale.log
Crystal Structure of ADP ribose phosphatase of NSP3 from SARS CoV-2 in
the complex with ADP ribose

Michalska, K., Kim, Y., Jedrzejczak, R., Maltseva, N., Endres, M.,
Mececar, A., Joachimiak, A., Center for Structural Genomics of
Infectious Diseases (CSGID)

To be published.
Data was collected on 23rd February 2020 on beamline 19-ID (SBC-CAT, APS) on a Pilatus3 6M and refined to 1.50 A using Phenix.
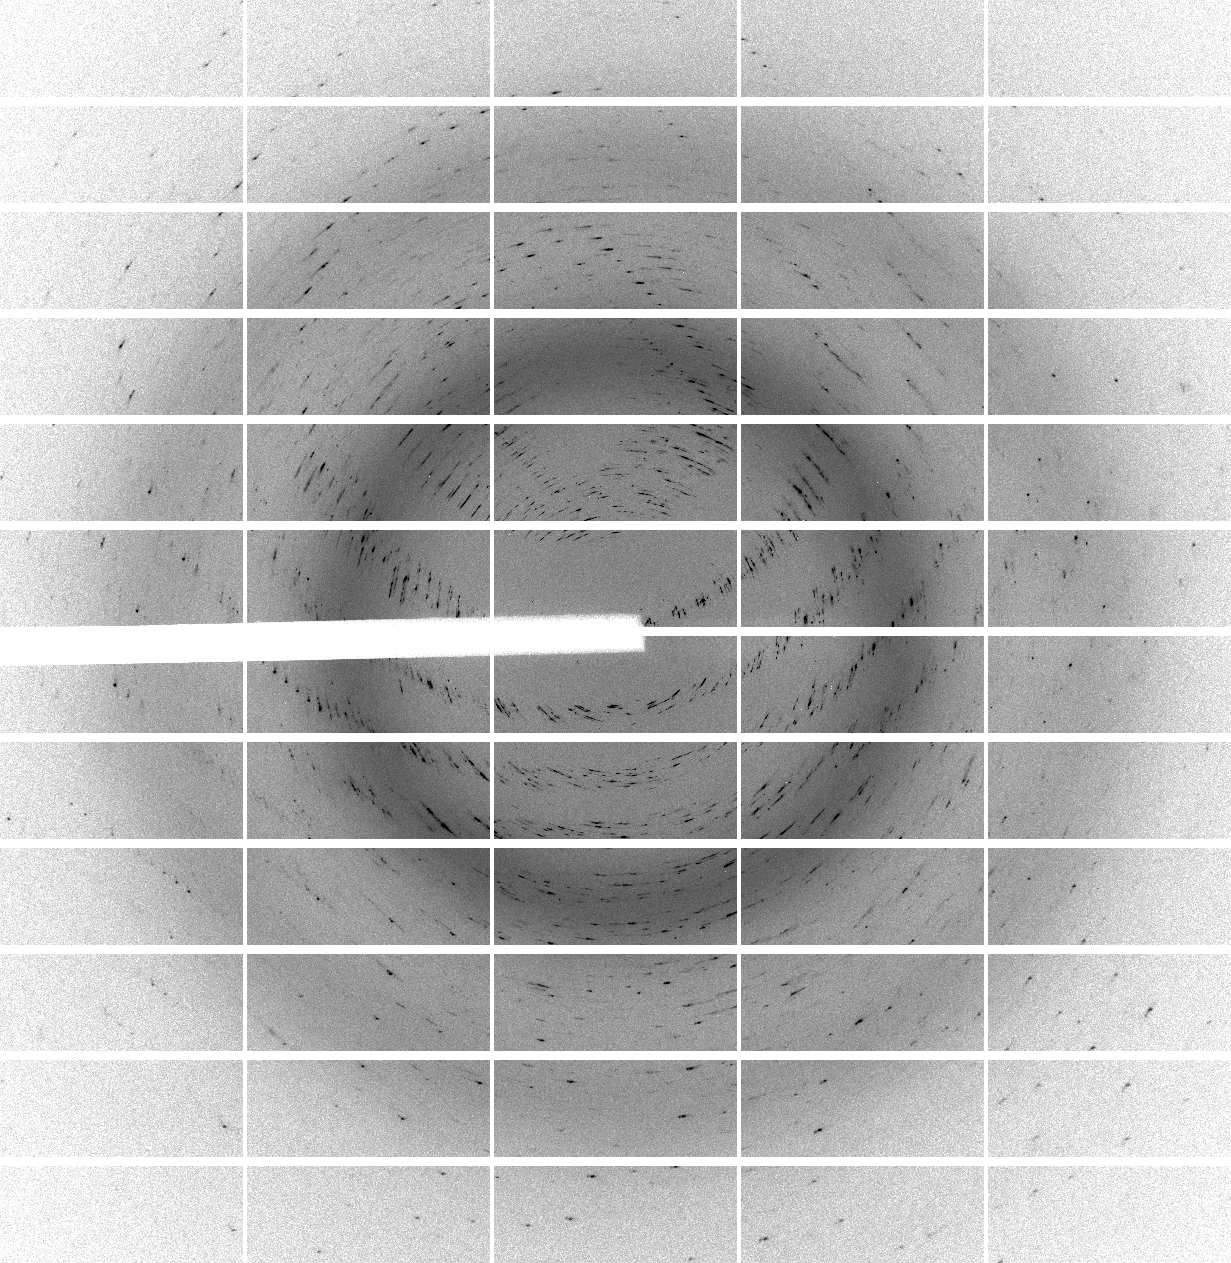
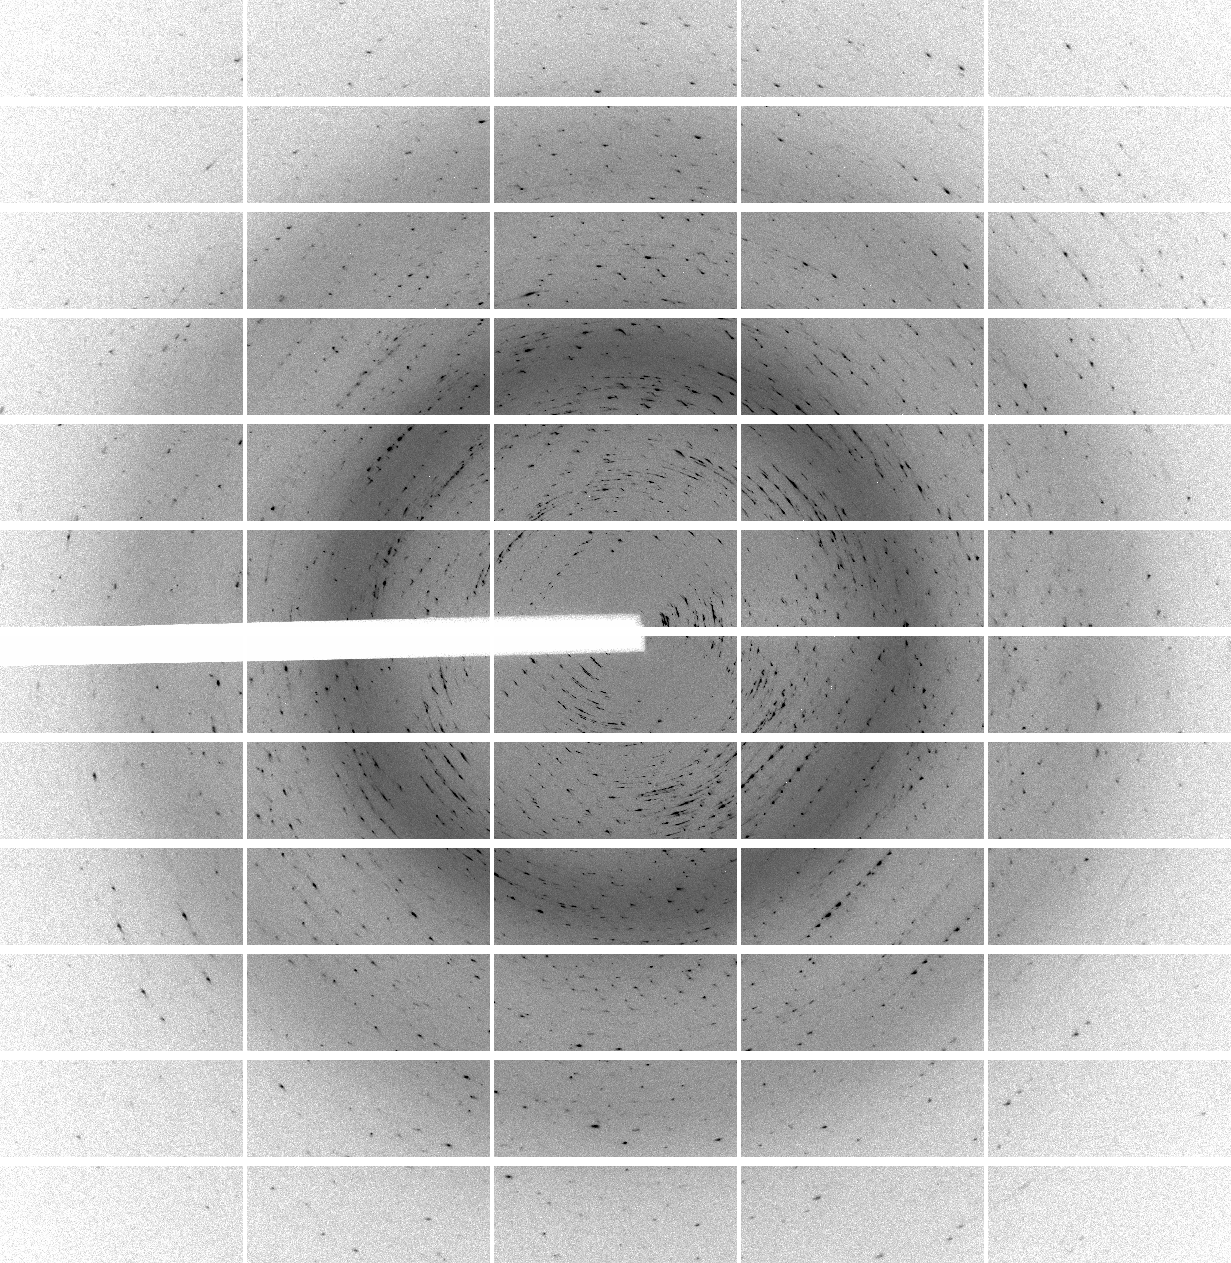
We have 700 images of 0.5 deg/image (i.e. 350 degrees of data) collected with 0.25 sec/image (resulting in rather high average background values of around 60 counts - a recurring theme of over-exposure and wide-slicing it seems). The diffraction quality is rather poor in terms of spot shape:
which is visible throughout the image range:
| 1 | 101 | 201 | 301 | 401 | 501 | 601 |
 |
 |
 |
 |
 |
 |
 |
Given the poor diffraction quality, we are going to set two additional parameters in autoPROC:
    process \
      -I Images ReverseRotationAxis=yes \
      -M LowResOrTricky \
      RunIdxrefStartWithTop=10000
which then gives us
Spacegroup name P1
Unit cell parameters 33.261 37.809 68.243 82.153 82.585 89.973
Wavelength 0.97918 A
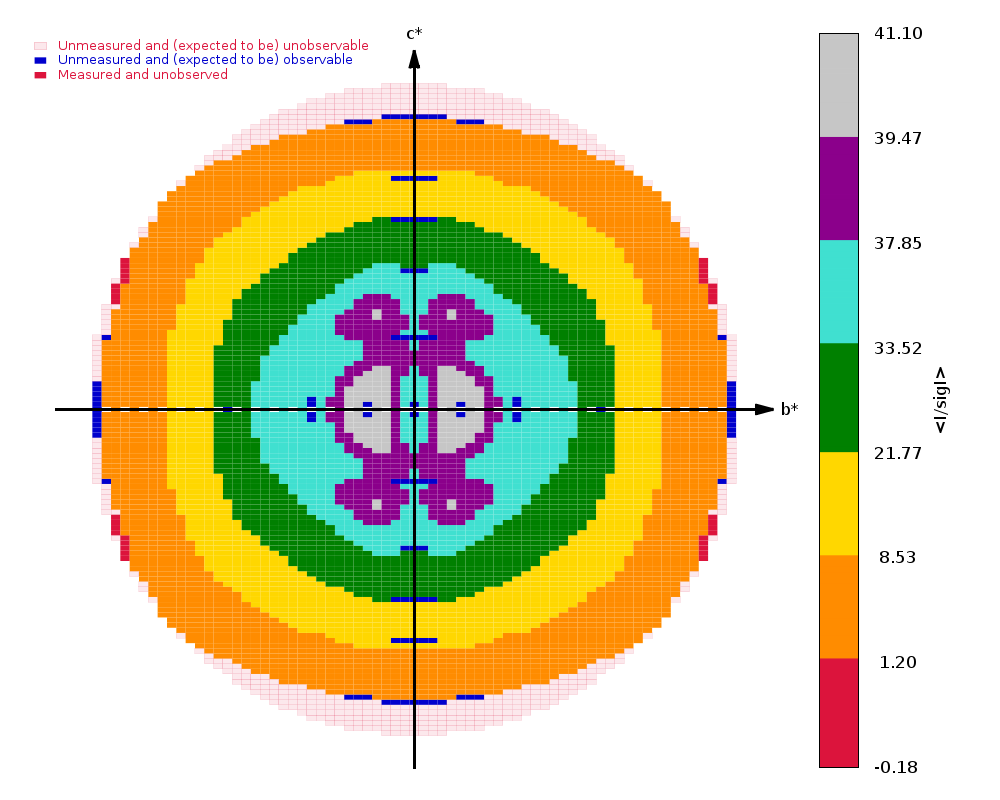
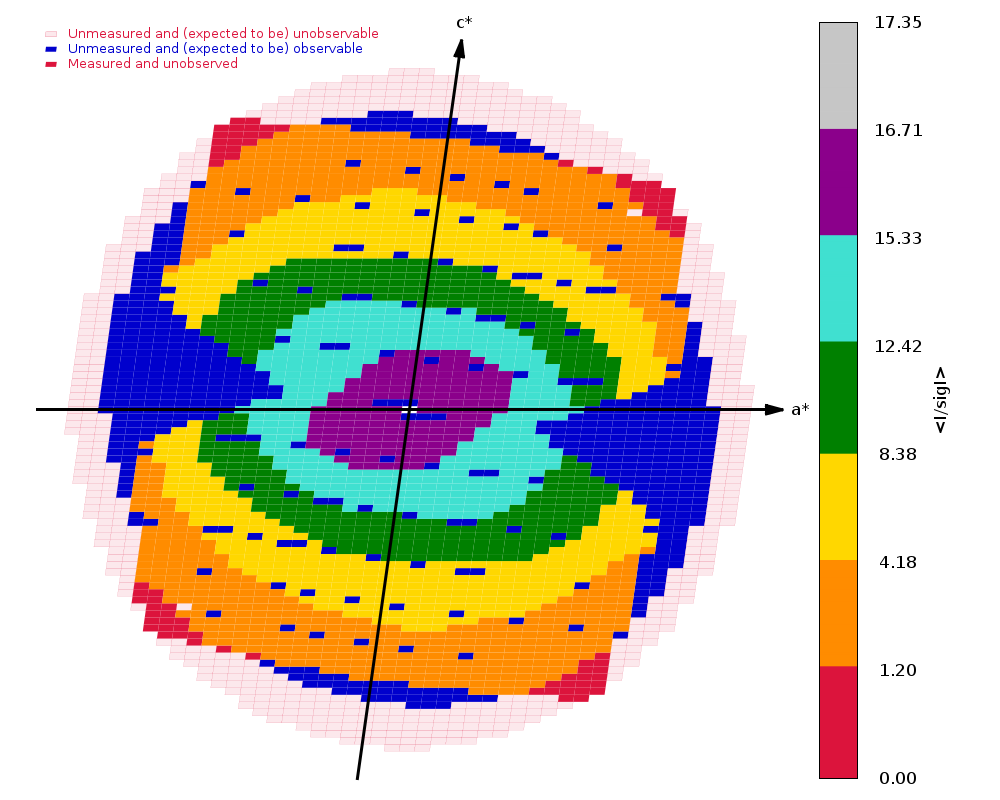
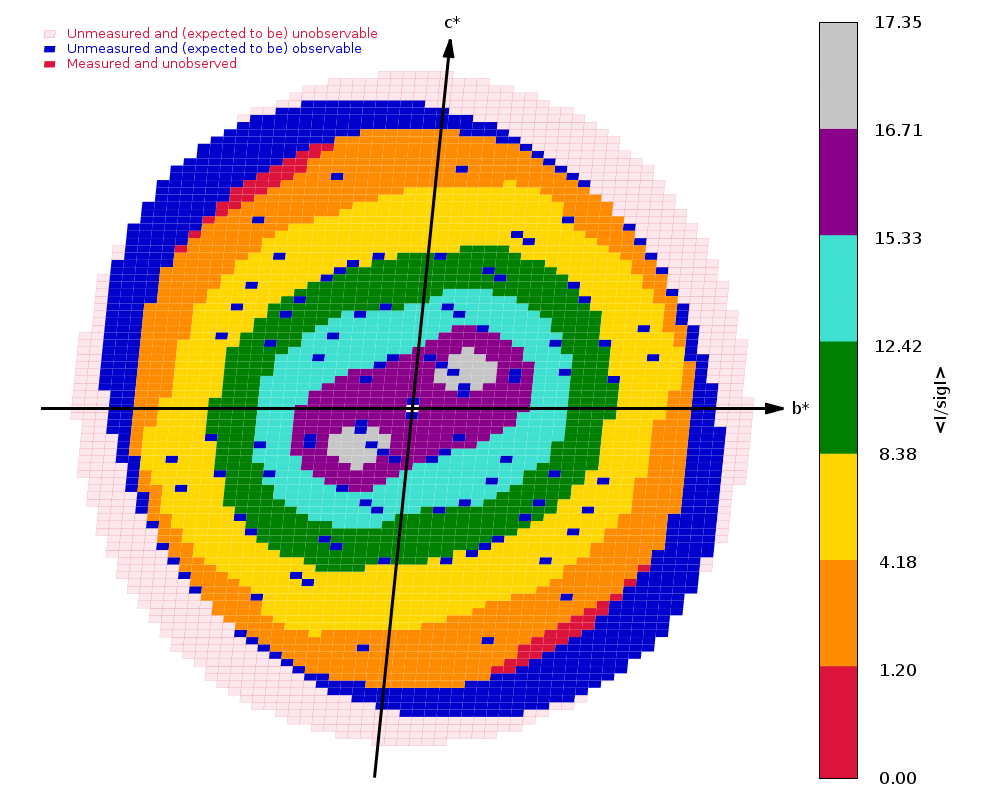
Diffraction limits & principal axes of ellipsoid fitted to diffraction cut-off surface:
1.521 0.7489 0.4003 -0.5281 0.648 _a_* + 0.394 _b_* - 0.652 _c_*
1.538 -0.4571 0.8890 0.0257 -0.407 _a_* + 0.899 _b_* + 0.160 _c_*
1.364 0.4797 0.2222 0.8488 0.243 _a_* + 0.128 _b_* + 0.962 _c_*
Criteria used in determination of diffraction limits:
-----------------------------------------------------
local(I/sigI) >= 1.20
Overall InnerShell OuterShell
---------------------------------------------------------------------------
Low resolution limit 67.028 67.028 1.470
High resolution limit 1.364 4.149 1.364
Rmerge (all I+ & I-) 0.041 0.037 0.201
Rmeas (all I+ & I-) 0.048 0.043 0.237
Rpim (all I+ & I-) 0.025 0.022 0.123
Total number of observations 161569 8014 7824
Total number unique 44888 2243 2244
Mean(I)/sd(I) 13.0 18.8 4.0
Completeness (spherical) 64.5 91.0 16.0
Completeness (ellipsoidal) 77.2 91.0 21.0
Multiplicity 3.6 3.6 3.5
CC(1/2) 0.998 0.996 0.968
 |
 |
 |
We get a few warnings about multiple lattices (no surprise), unindexed spots (also no surprise) and overloaded reflections (not surprising given the data collection parameters chosen).
Crystal Structure of ADP ribose phosphatase of NSP3 from SARS-CoV-2 in
the apo form

Michalska, K., Stols, L., Jedrzejczak, R., Endres, M., Babnigg, G.,
Kim, Y., Joachimiak, A., Center for Structural Genomics of Infectious
Diseases (CSGID)

To be published.
Data was collected on 31st March 2020 on beamline 19-ID (SBC-CAT, APS) on a Pilatus3 6M and refined to 1.35 A using REFMAC.
There are two sweeps of data
  ADRP_Pmin_F11_d1_data_#####.cbf   : 1 - 720
  ADRP_Pmin_F11_d1_data2_#####.cbf  : 1 - 200
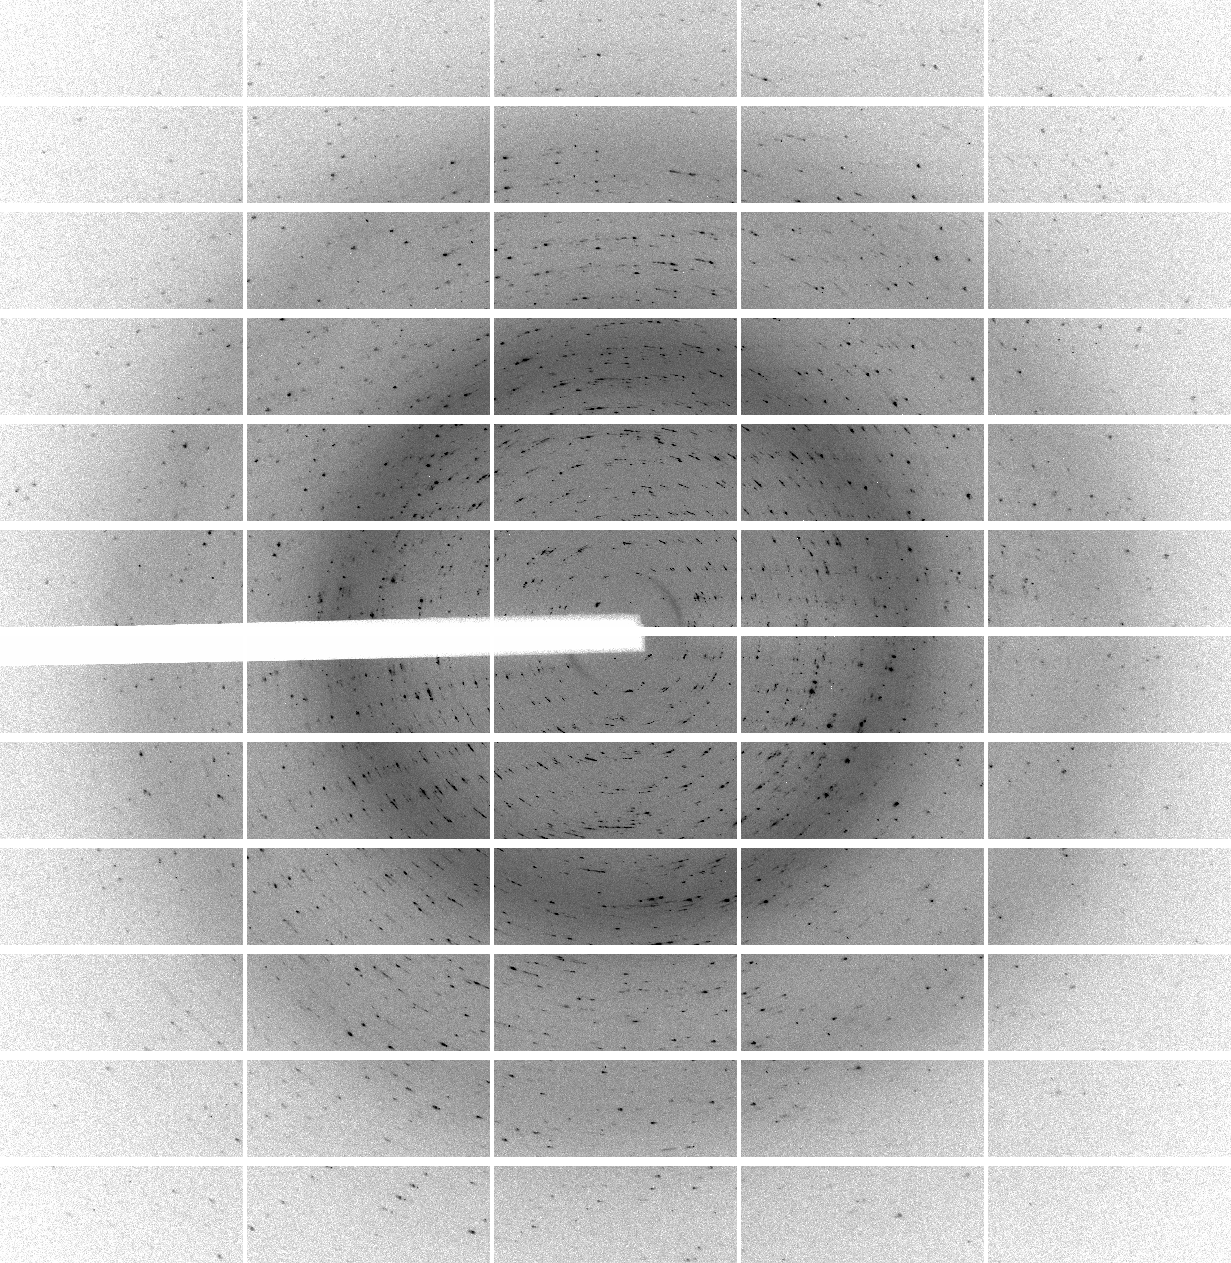
Both are collected as high-dose (0.25 sec/image) and wide-sliced (0.5 deg/image), but with the second at a much closer distance (157 mm) than the first (300 mm) - because the crystal diffracts rather well.
Running autoPROC gives us
  Spacegroup name          C2
  Unit cell parameters     139.5938 29.6609 37.8595 90.0000 103.5076 90.0000
  Wavelength               0.97918 A

  Diffraction limits & principal axes of ellipsoid fitted to diffraction cut-off surface:
    1.137         0.9288   0.0000  -0.3706       0.986 _a_* - 0.166 _c_*
    1.169         0.0000   1.0000   0.0000       _b_*
    1.081         0.3706   0.0000   0.9288       0.858 _a_* + 0.513 _c_*


  Number of RUNs (sweeps) contributing to this dataset =   2

  Criteria used in determination of diffraction limits:
  -----------------------------------------------------
     local(I/sigI)  >=    1.20

                                              Overall  InnerShell  OuterShell
  ---------------------------------------------------------------------------
     Low resolution limit                      36.083      36.083       1.169
     High resolution limit                      1.081       3.149       1.081


     Rmerge  (all I+ & I-)                      0.118       0.056       0.581
     Rmeas   (all I+ & I-)                      0.129       0.060       0.743
     Rpim    (all I+ & I-)                      0.049       0.021       0.459
     Total number of observations              264271       21814        4685
     Total number unique                        47849        2712        2279
     Mean(I)/sd(I)                               12.0        34.2         1.5
     Completeness (spherical)                    73.8        98.4        16.9
     Completeness (ellipsoidal)                  82.9        98.4        32.4
     Multiplicity                                 5.5         8.0         2.1
     CC(1/2)                                    0.995       0.998       0.437
and
 |
 |
 |
Files:
Crystal Structure of ADP ribose phosphatase of NSP3 from SARS-CoV-2
in complex with MES

Michalska, K., Kim, Y., Jedrzejczak, R., Maltseva, N., Endres, M.,
Mececar, A., Joachimiak, A., Center for Structural Genomics of
Infectious Diseases (CSGID)

To be published.
Data was collected on 25th March 2020 on beamline 19-ID (SBC-CAT, APS) on a Pilatus3 6M and refined to 1.07 A using Phenix.
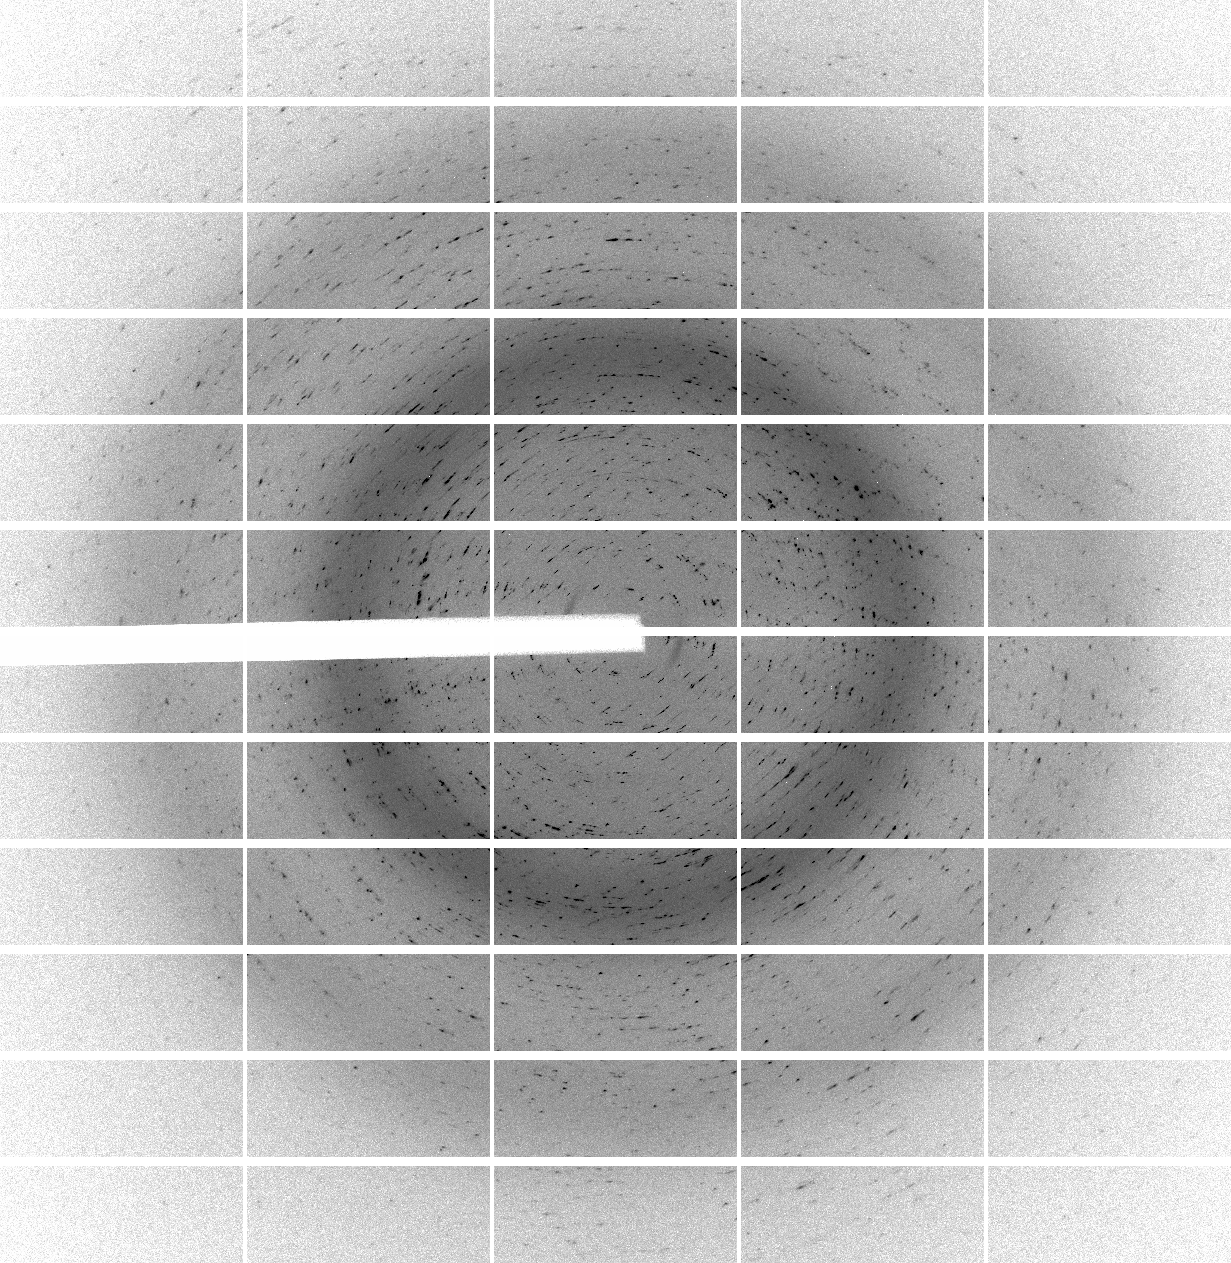
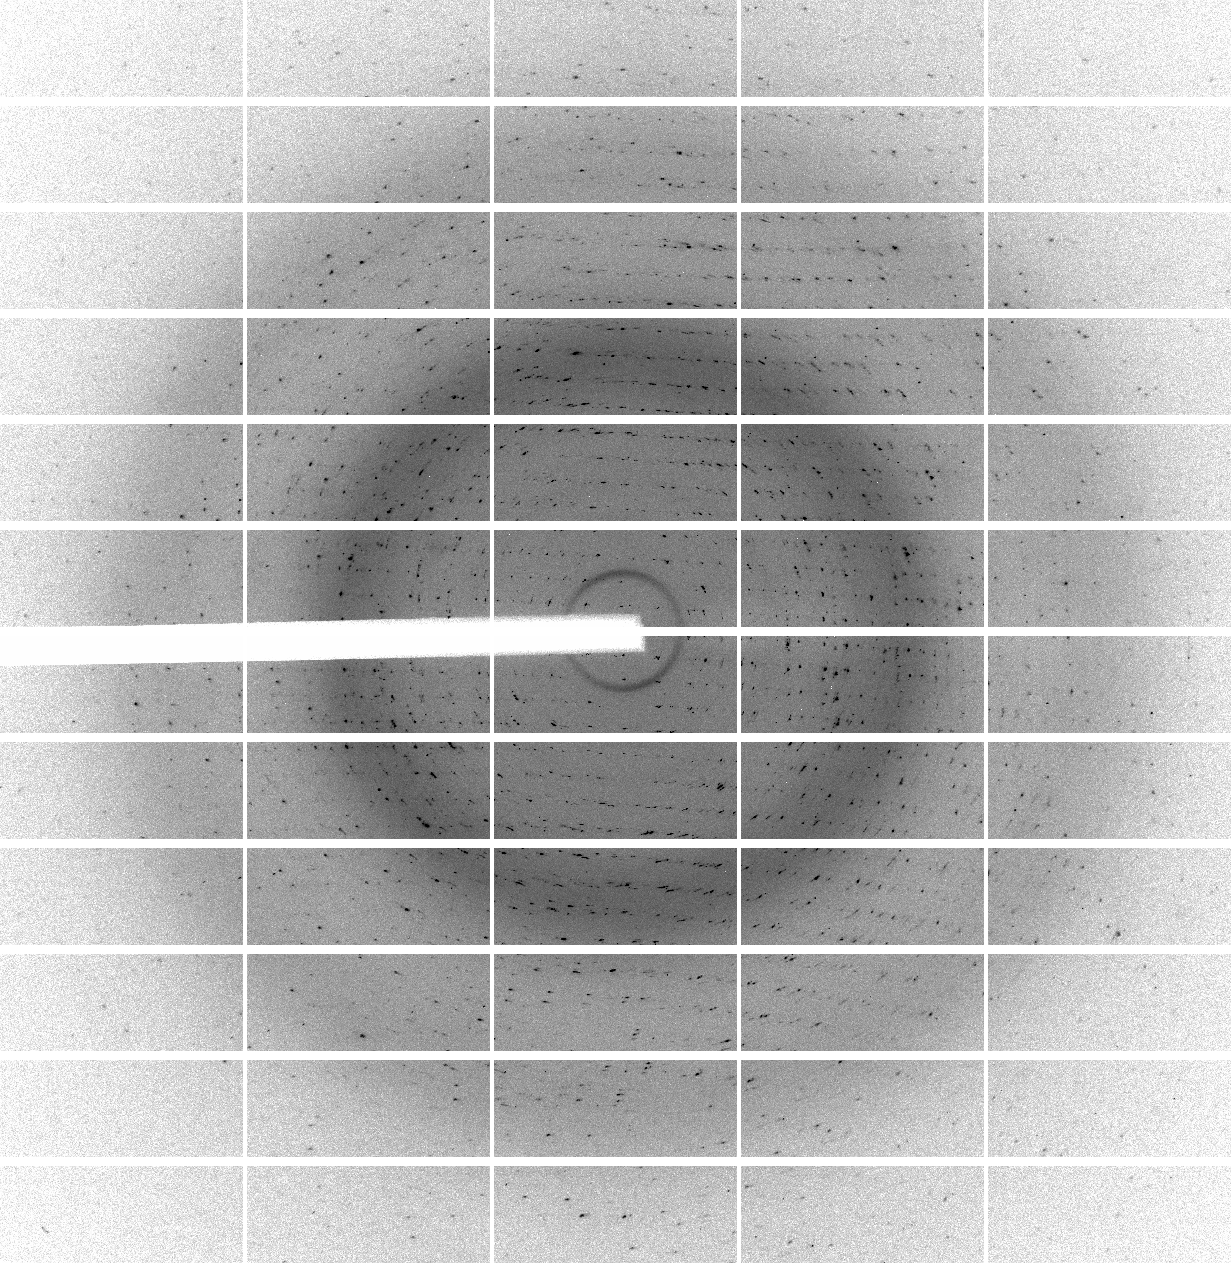
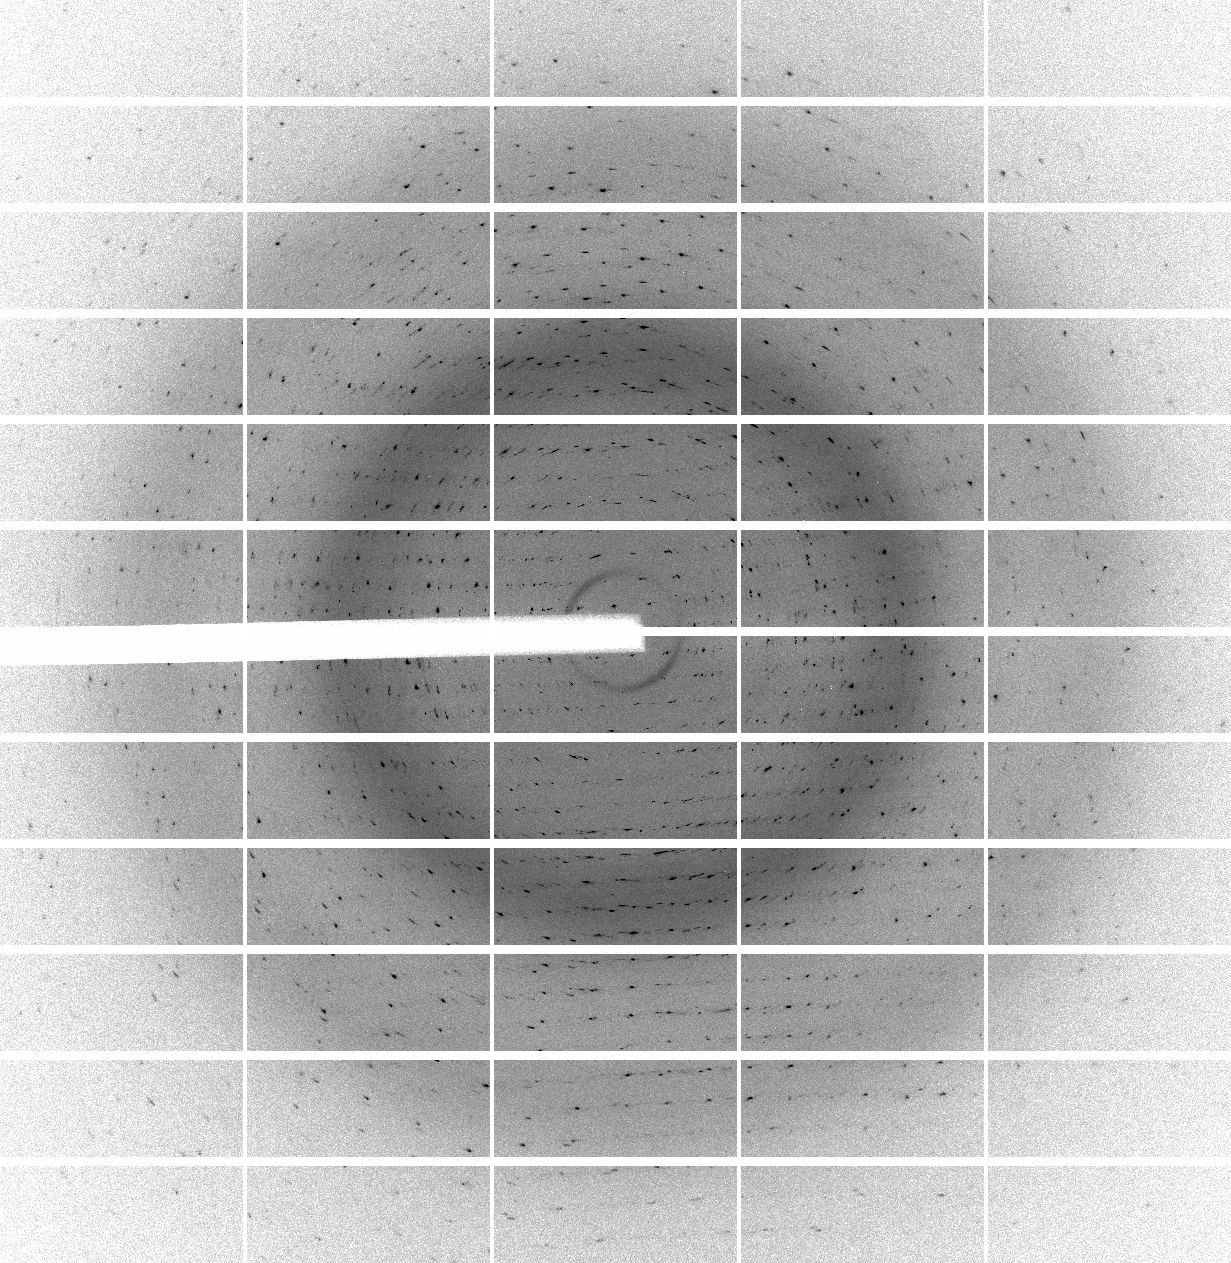
We have 1440 images collected at 0.25 deg/image (so no longer really wide-slicing, but not quite fine-slicing either) with an exposure time of 0.15 sec/image. That gives 360 degrees of data - but still with an exceptionally high average background count:
(my emphasis to draw attention to very high counts in diffraction peak and background). A factor of 50-100 less flux might have been advisable.
autoPROC gives us
  Spacegroup name          P21
  Unit cell parameters     37.177 33.174 60.612 90.000 96.181 90.000
  Wavelength               0.97918 A

  Diffraction limits & principal axes of ellipsoid fitted to diffraction cut-off surface:
    1.176         0.7730   0.0000  -0.6345       0.553 _a_* - 0.833 _c_*
    0.971         0.0000   1.0000   0.0000       _b_*
    0.960         0.6345   0.0000   0.7730       0.486 _a_* + 0.874 _c_*


  Criteria used in determination of diffraction limits:
  -----------------------------------------------------
     local(I/sigI)  >=    1.20

                                              Overall  InnerShell  OuterShell
  ---------------------------------------------------------------------------
     Low resolution limit                      30.130      30.130       1.031
     High resolution limit                      0.960       2.898       0.960


     Rmerge  (all I+ & I-)                      0.054       0.040       1.008
     Rmeas   (all I+ & I-)                      0.059       0.044       1.175
     Rpim    (all I+ & I-)                      0.022       0.017       0.588
     Total number of observations              436570       22167       12554
     Total number unique                        66917        3344        3347
     Mean(I)/sd(I)                               15.2        37.6         1.4
     Completeness (spherical)                    74.6        98.3        19.5
     Completeness (ellipsoidal)                  90.9        98.3        48.1
     Multiplicity                                 6.5         6.6         3.8
     CC(1/2)                                    0.998       0.997       0.400
and
 |
 |
 |
Files: