Content:
These refinements were done without user interaction, so consisting of two basic steps: (1) fetching the deposited data and (2) running some simple series of refinement steps with BUSTER.
We would encourage the deposition of raw images if at all possible (see here). In case you want to learn one approach of working with deposited raw data: see the autoPROC wiki.
A lot of these show the impact better data (higher reported resolution limit taken as a proxy for this) and improved software/algorithms (date of data deposition) can potentially have. Hopefully, a few structures show significant improvements - and were a re-refinement clearly does worse than the original refinements we can learn lessons and see if and where our software and/or protocols can be improved.
| Metric | Coloured by resolution | Coloured by date deposited | Remark |
| Rwork | 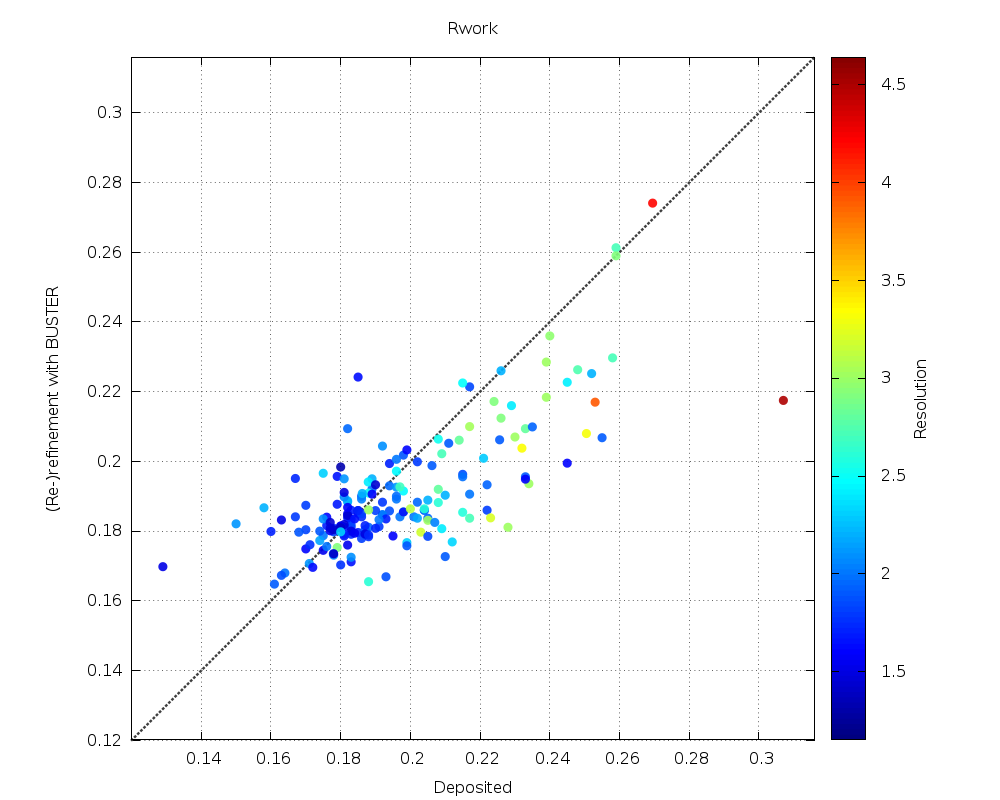 |
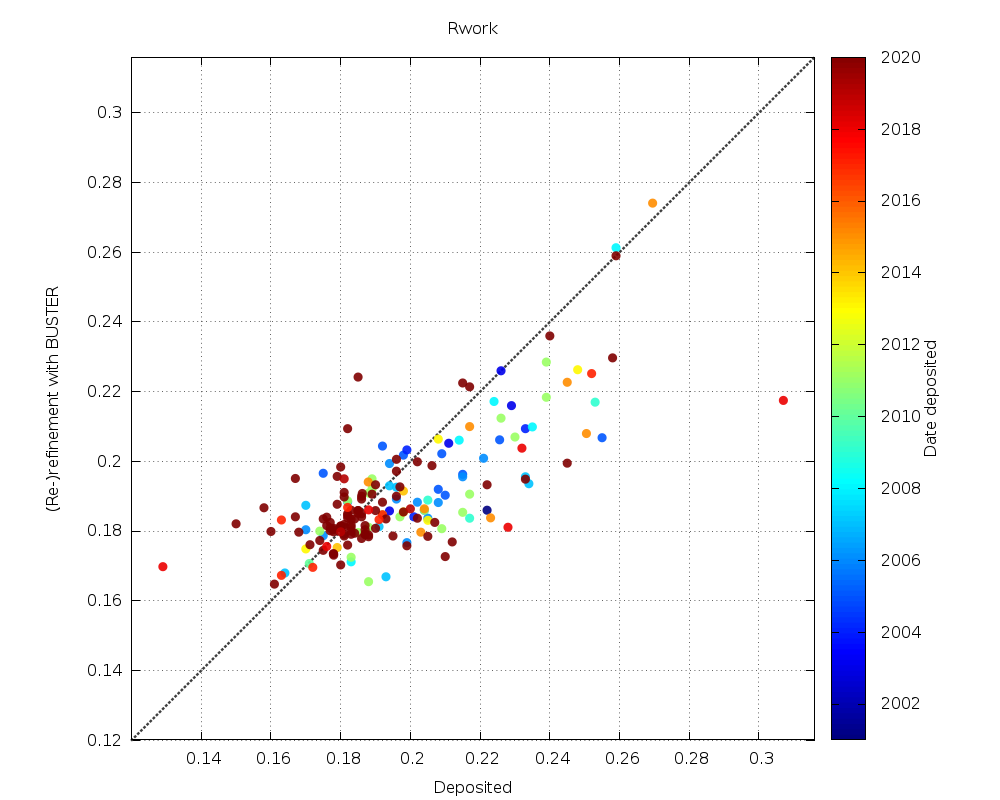 |
some lowering especially for older structures with higher deposited Rwork values |
| Rfree | 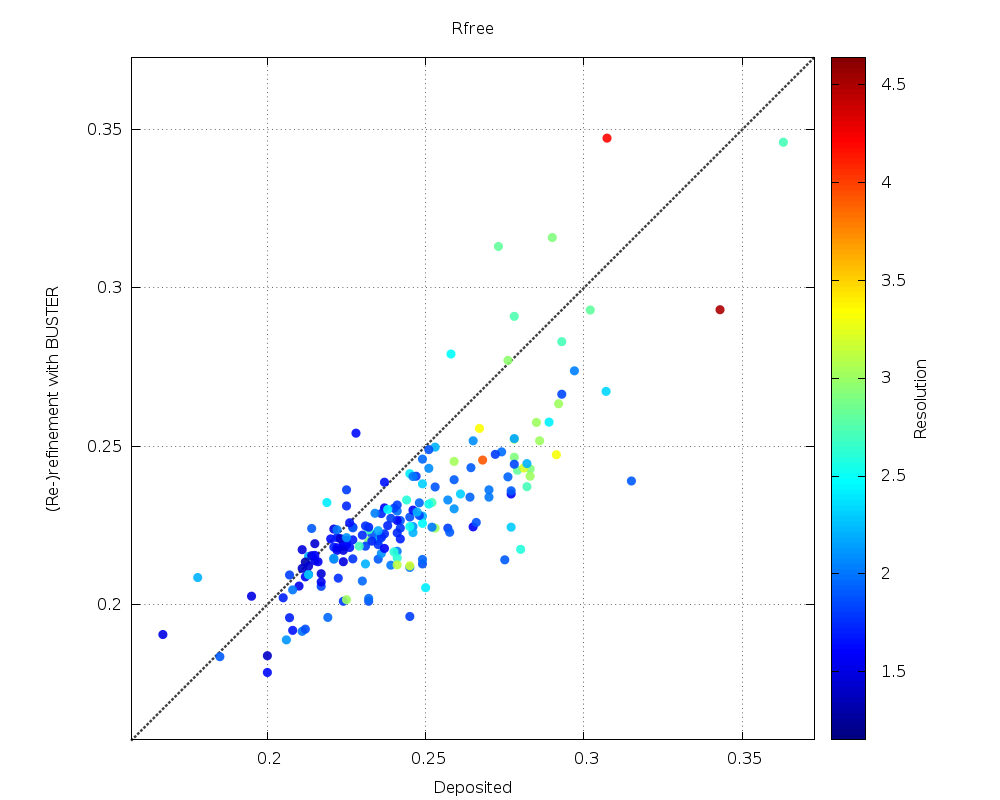 |
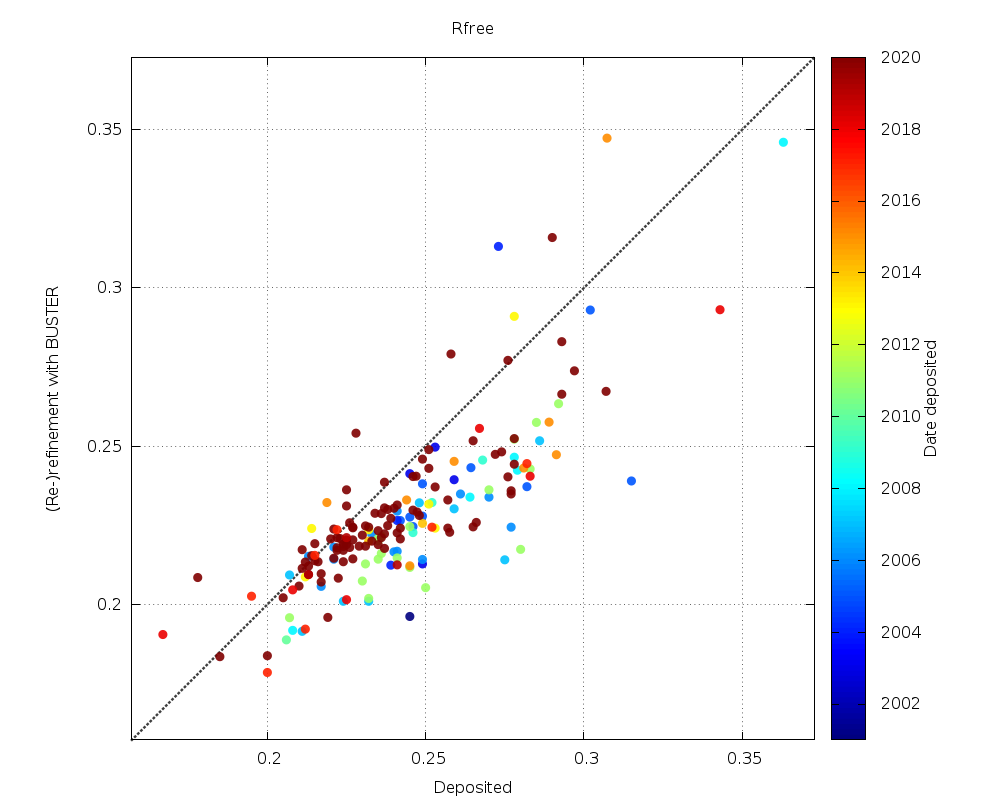 |
mostly lower values |
| Rfree-Rwork | 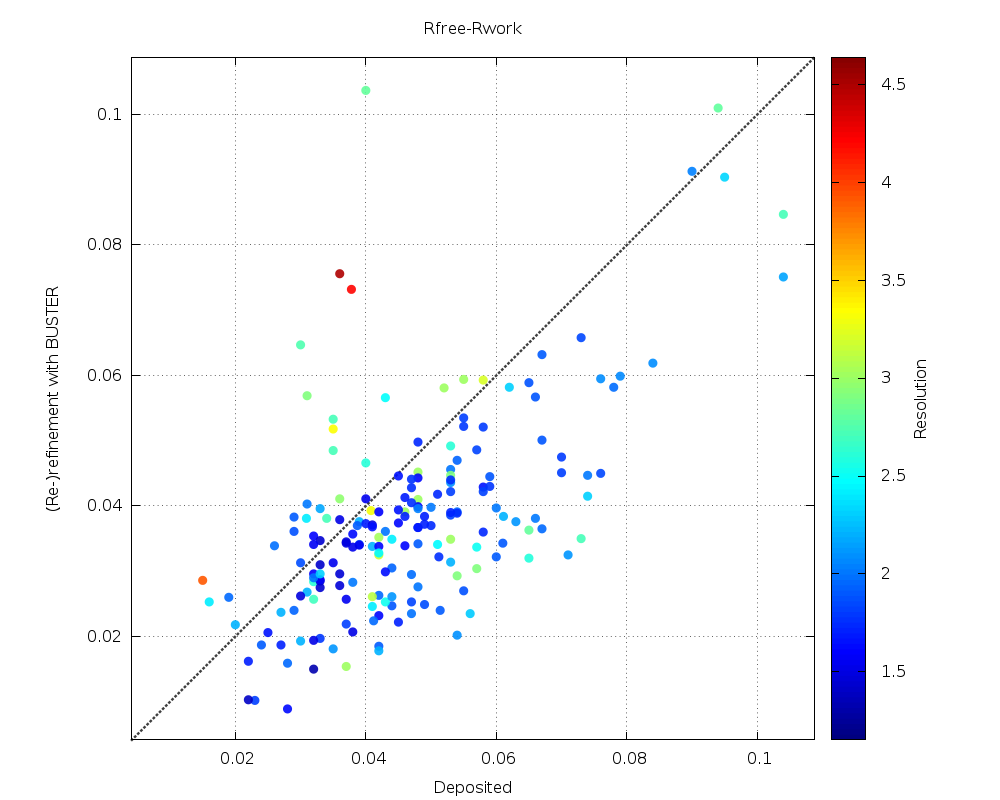 |
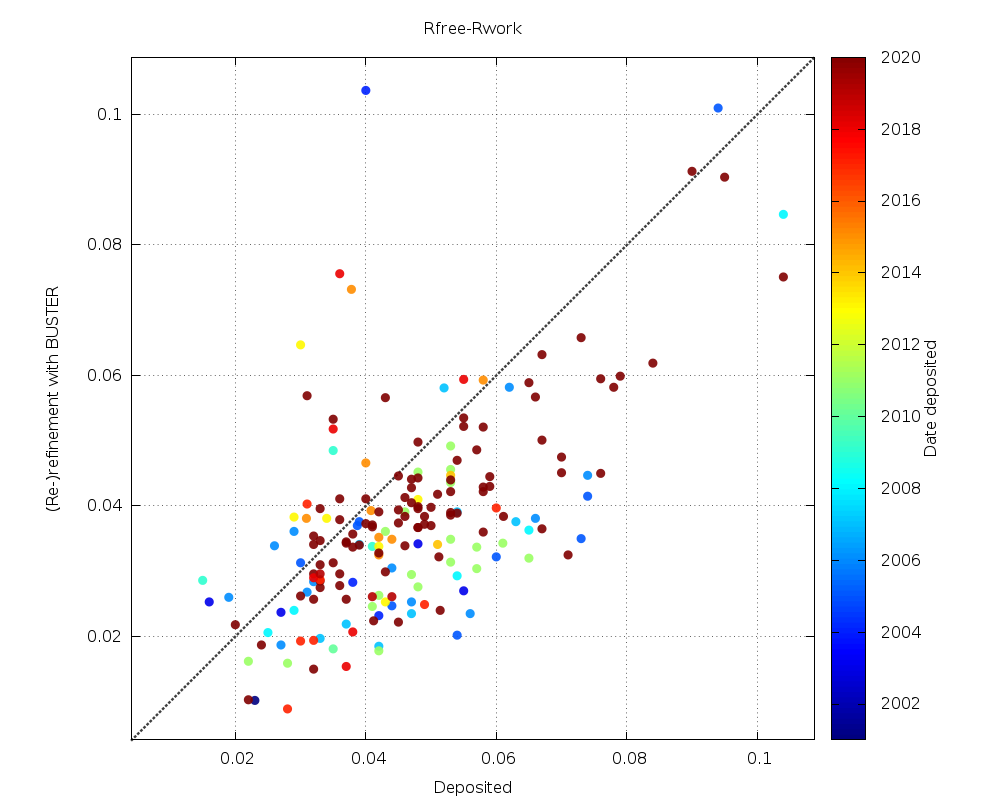 |
a significant number with lower Rfree-Rwork gap (good, less danger of overfitting) - but also some with higher values (especially for lower-resolution datasets) |
| Clashscore | 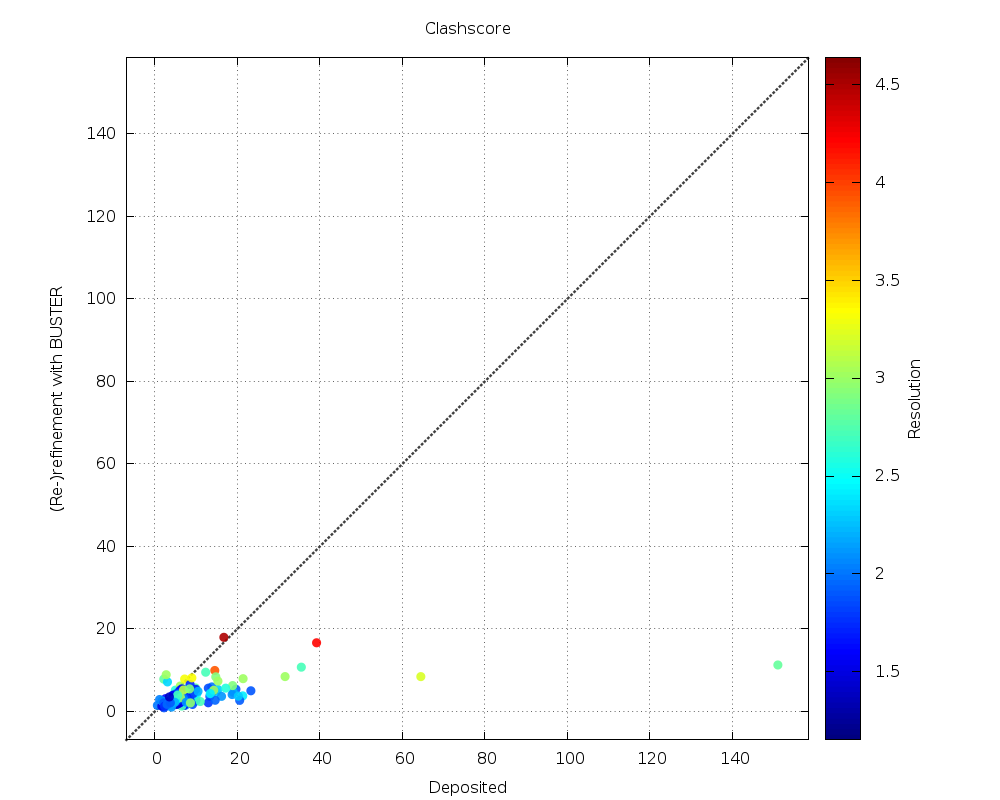 |
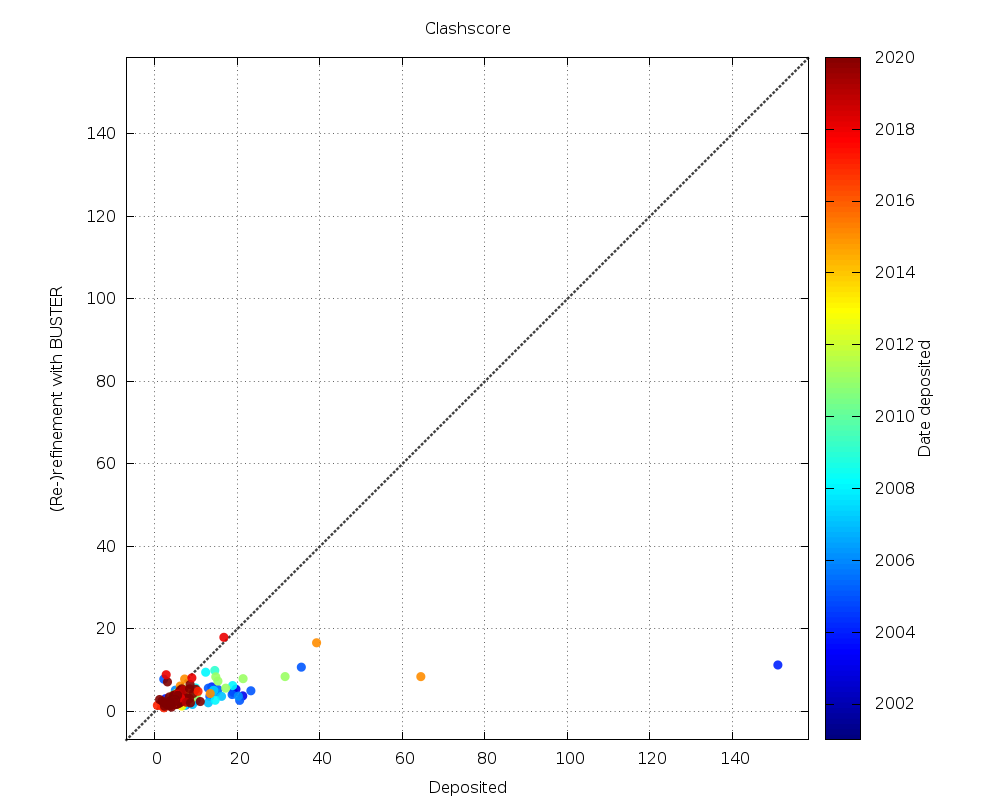 |
nearly all lower - especially for some very significant outliers |
| Ramachandran (favoured) | 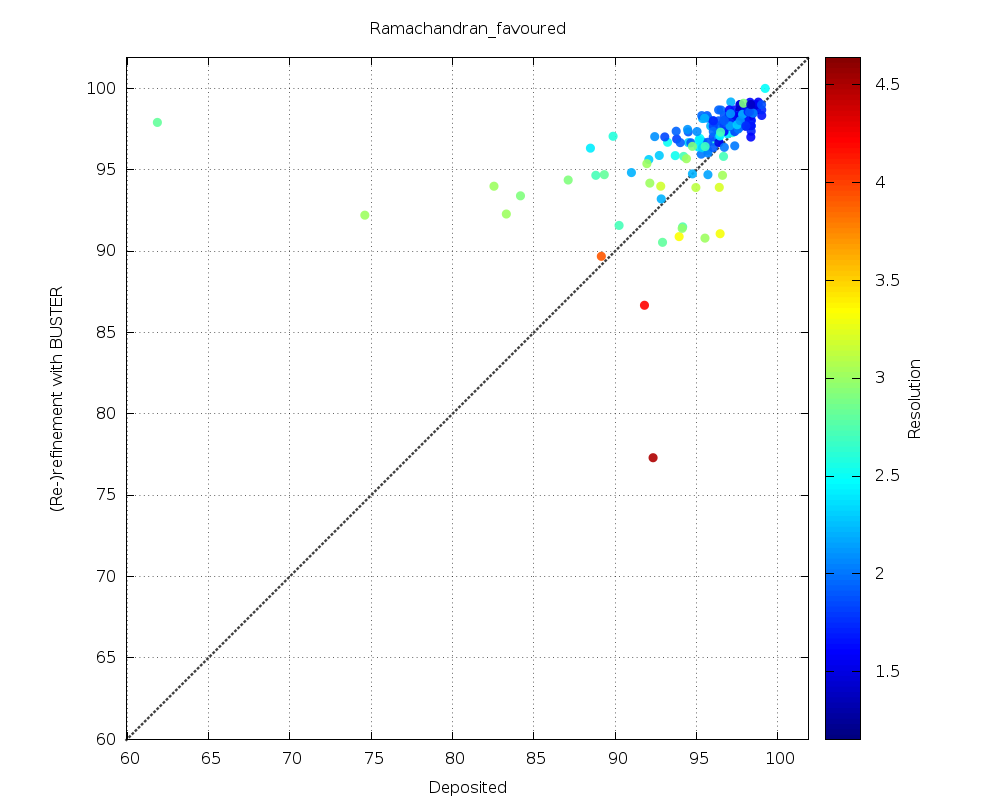 |
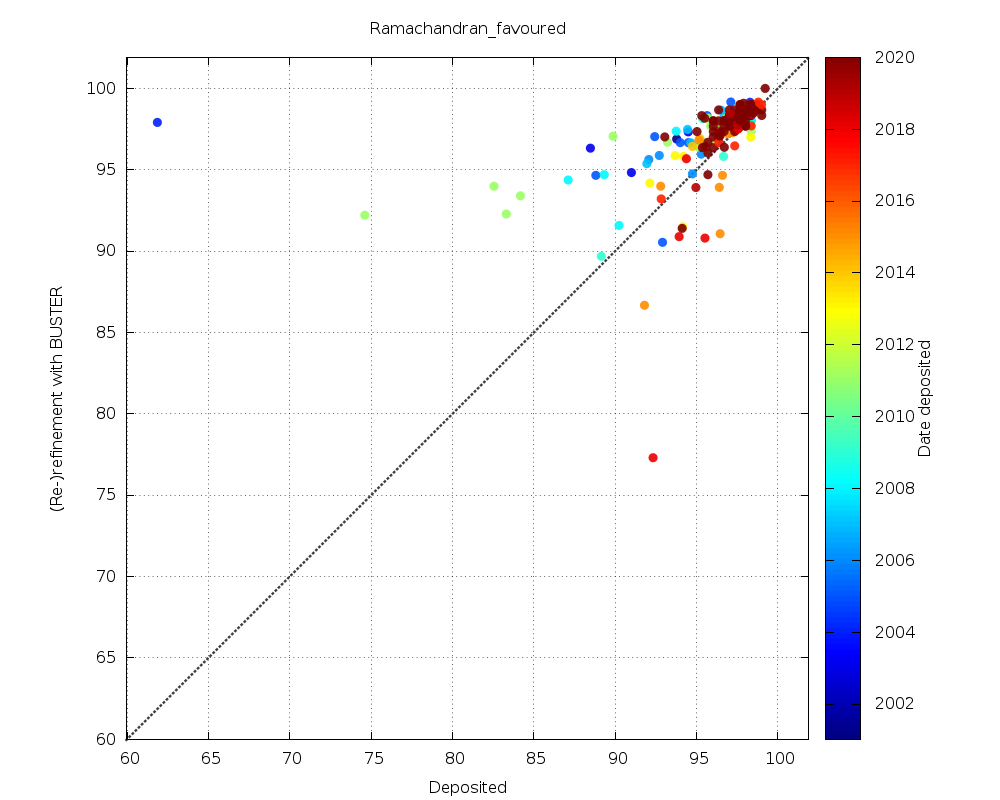 |
a fair amount of improvements, but also (especially for lower-resolution data) some obvious problem cases |
| Number of HOH | 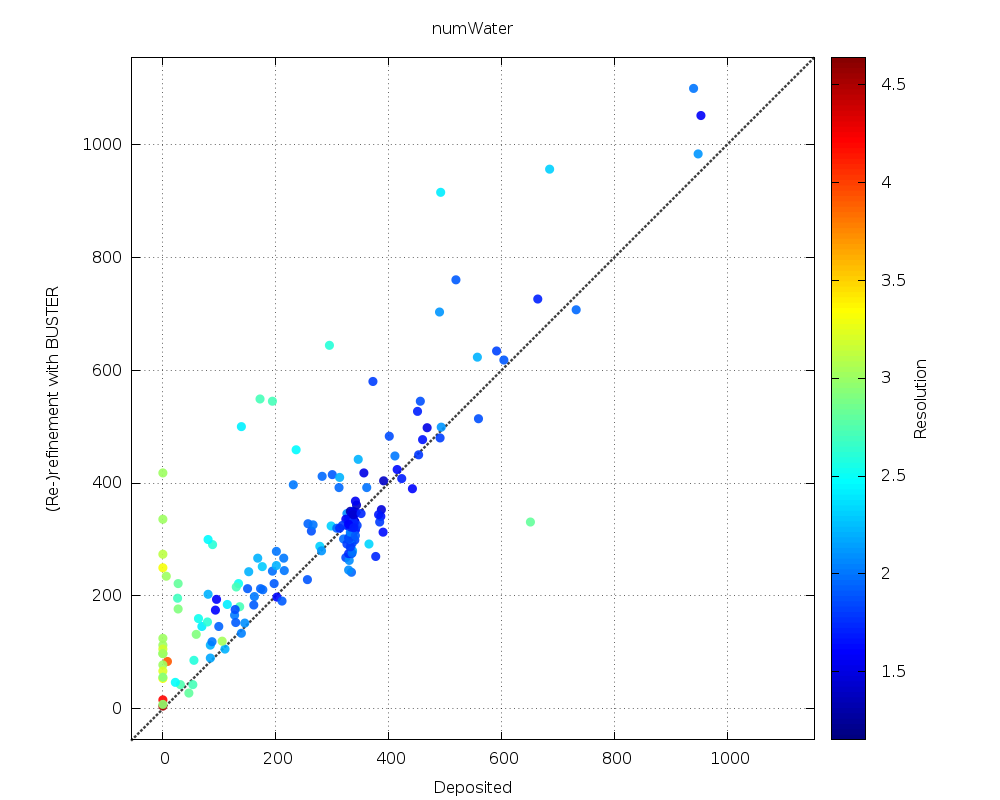 |
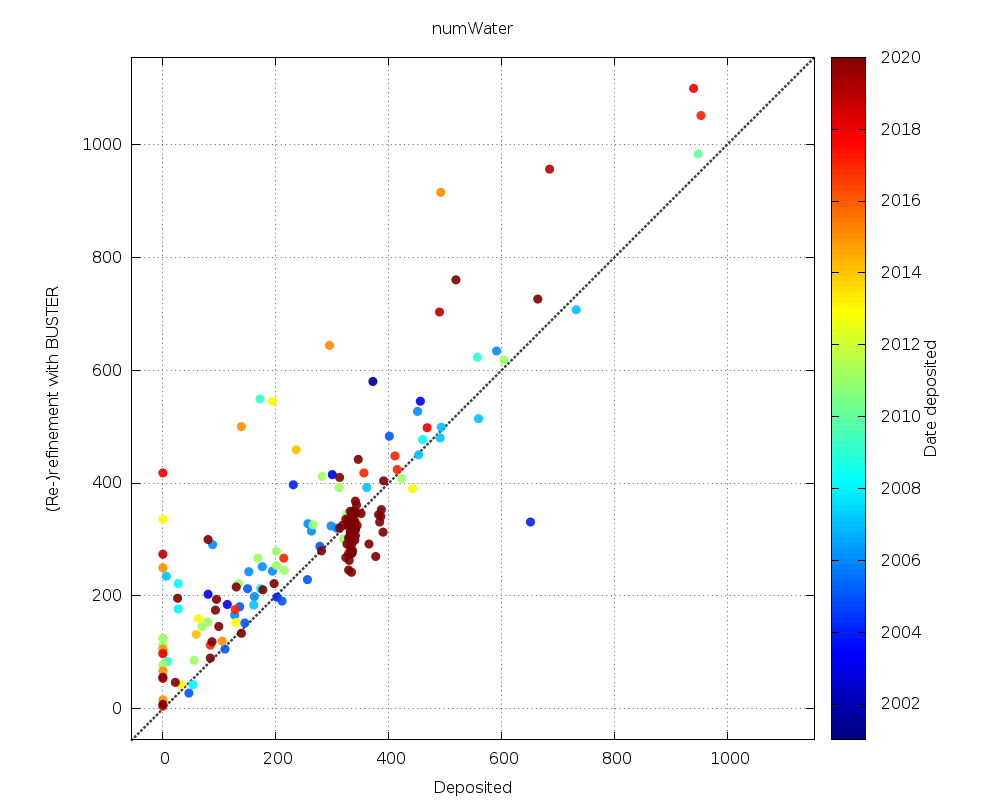 |
generally increased number of waters (apart from some outliers); a few structures at medium resolution seem to have no waters at all as deposited |
Some detailed comparison of various metrics (189 (re-)refinements as of now):
| Metric | (re-)refined > deposited | (re-)refined == deposited | (re-)refined < deposited |
| Rwork | 38.1% | 1.1% | 60.8% |
| Rfree | 13.8% | 0.0% | 86.2% |
| Rfree-Rwork | 18.0% | 0.0% | 82.0% |
| Ramachandran outliers | 12.2% | 56.1% | 31.7% |
| Ramachandran favoured | 77.8% | 7.4% | 14.8% |
| Rotamer outliers | 49.2% | 14.3% | 36.5% |
| Clashscore | 5.3% | 1.1% | 93.7% |
| rms bond | 37.6% | 0.5% | 61.9% |
| rms angle | 42.3% | 0.5% | 57.1% |
| MolProbity score | 13.2% | 0.5% | 86.2% |
| meanB all | 77.2% | 0.0% | 22.8% |
| meanB protein | 75.7% | 0.5% | 23.8% |
| meanB water | 88.4% | 0.0% | 11.6% |
| minB all | 63.5% | 0.0% | 36.5% |
| minB protein | 76.2% | 0.5% | 23.3% |
| minB water | 58.2% | 0.0% | 41.8% |
| maxB all | 52.9% | 0.0% | 47.1% |
| maxB protein | 34.9% | 0.0% | 65.1% |
| maxB water | 74.6% | 0.0% | 25.4% |
| numWater | 63.5% | 0.0% | 36.5% |